Gorbel Co-Op
Gorbel is a mid-sized company based in Fishers NY making cranes and other ergonomic lifting and warehouse solutions. My co-op was with the robotics engineering team within product development.
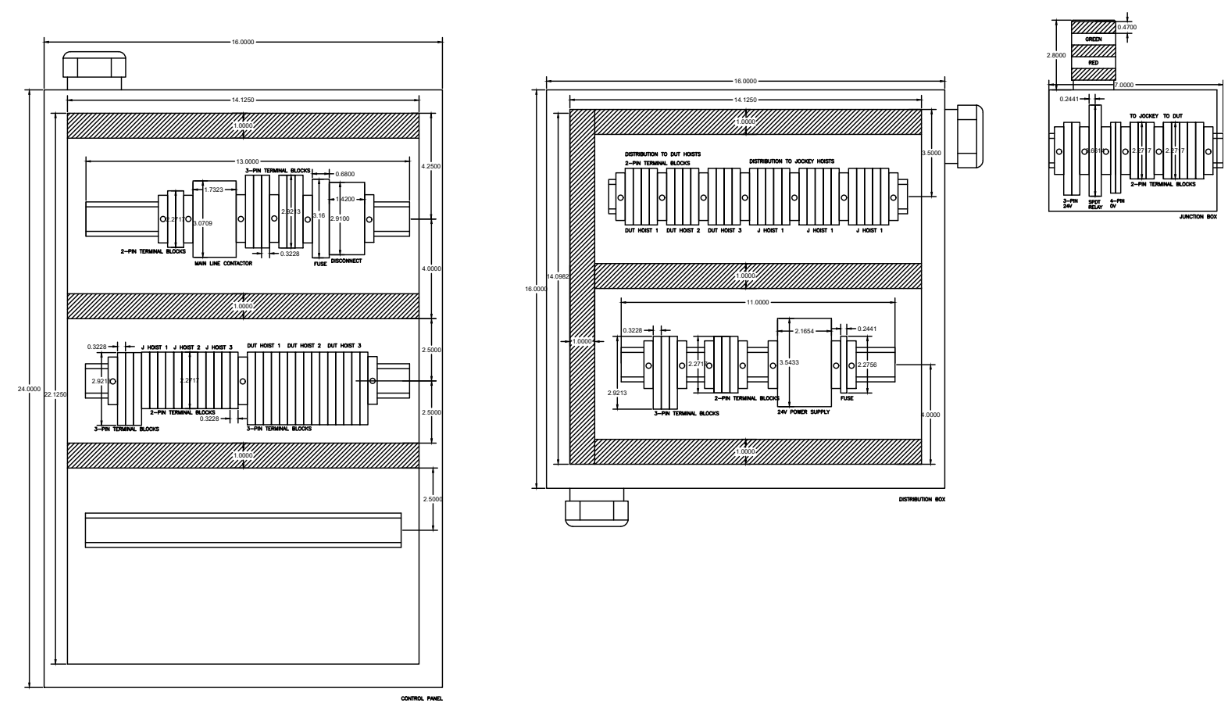
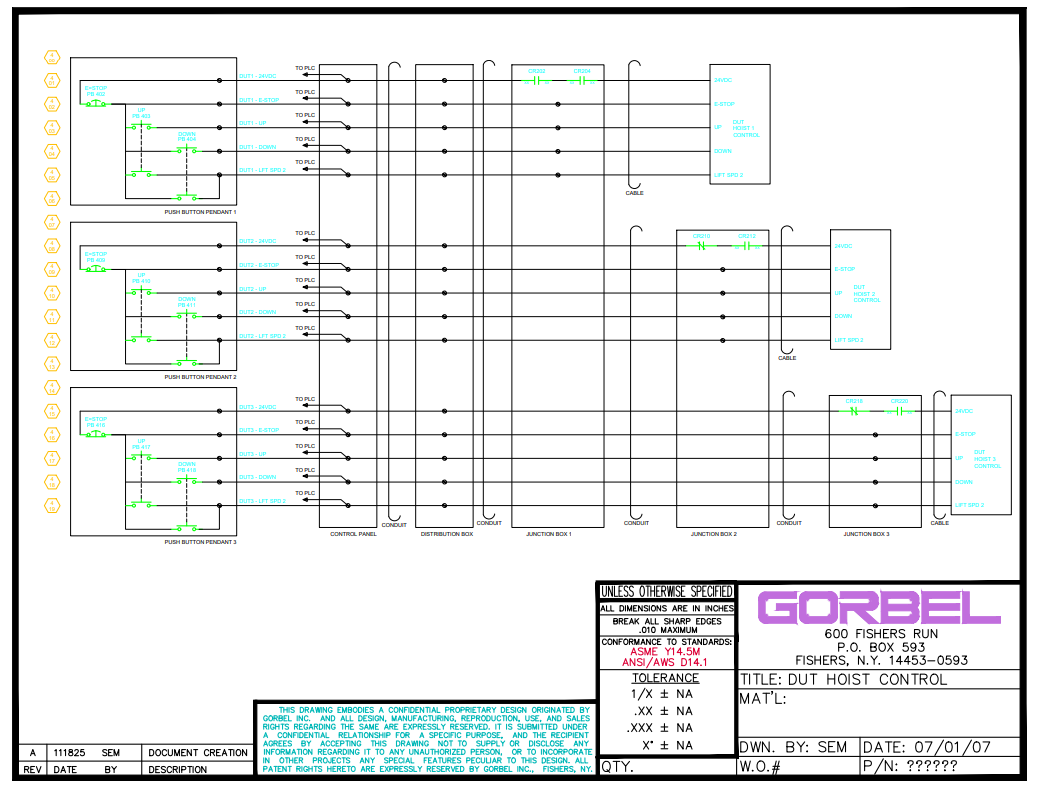
Electrical Design for Test Fixture
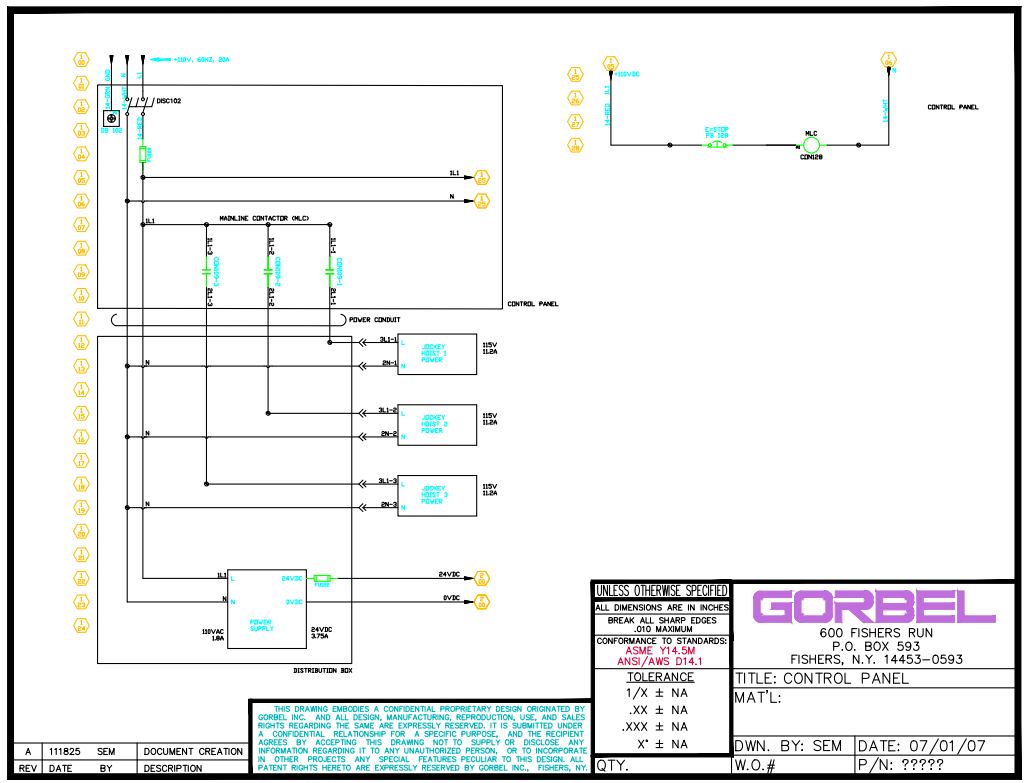
These panel layout drawings realize the electrical design above for the control panel (left), distribution box (middle), and junction boxes (right). I optimized the panel design for servicability and space, including room on the bottom of the contol panel for a PLC to be implemented later.
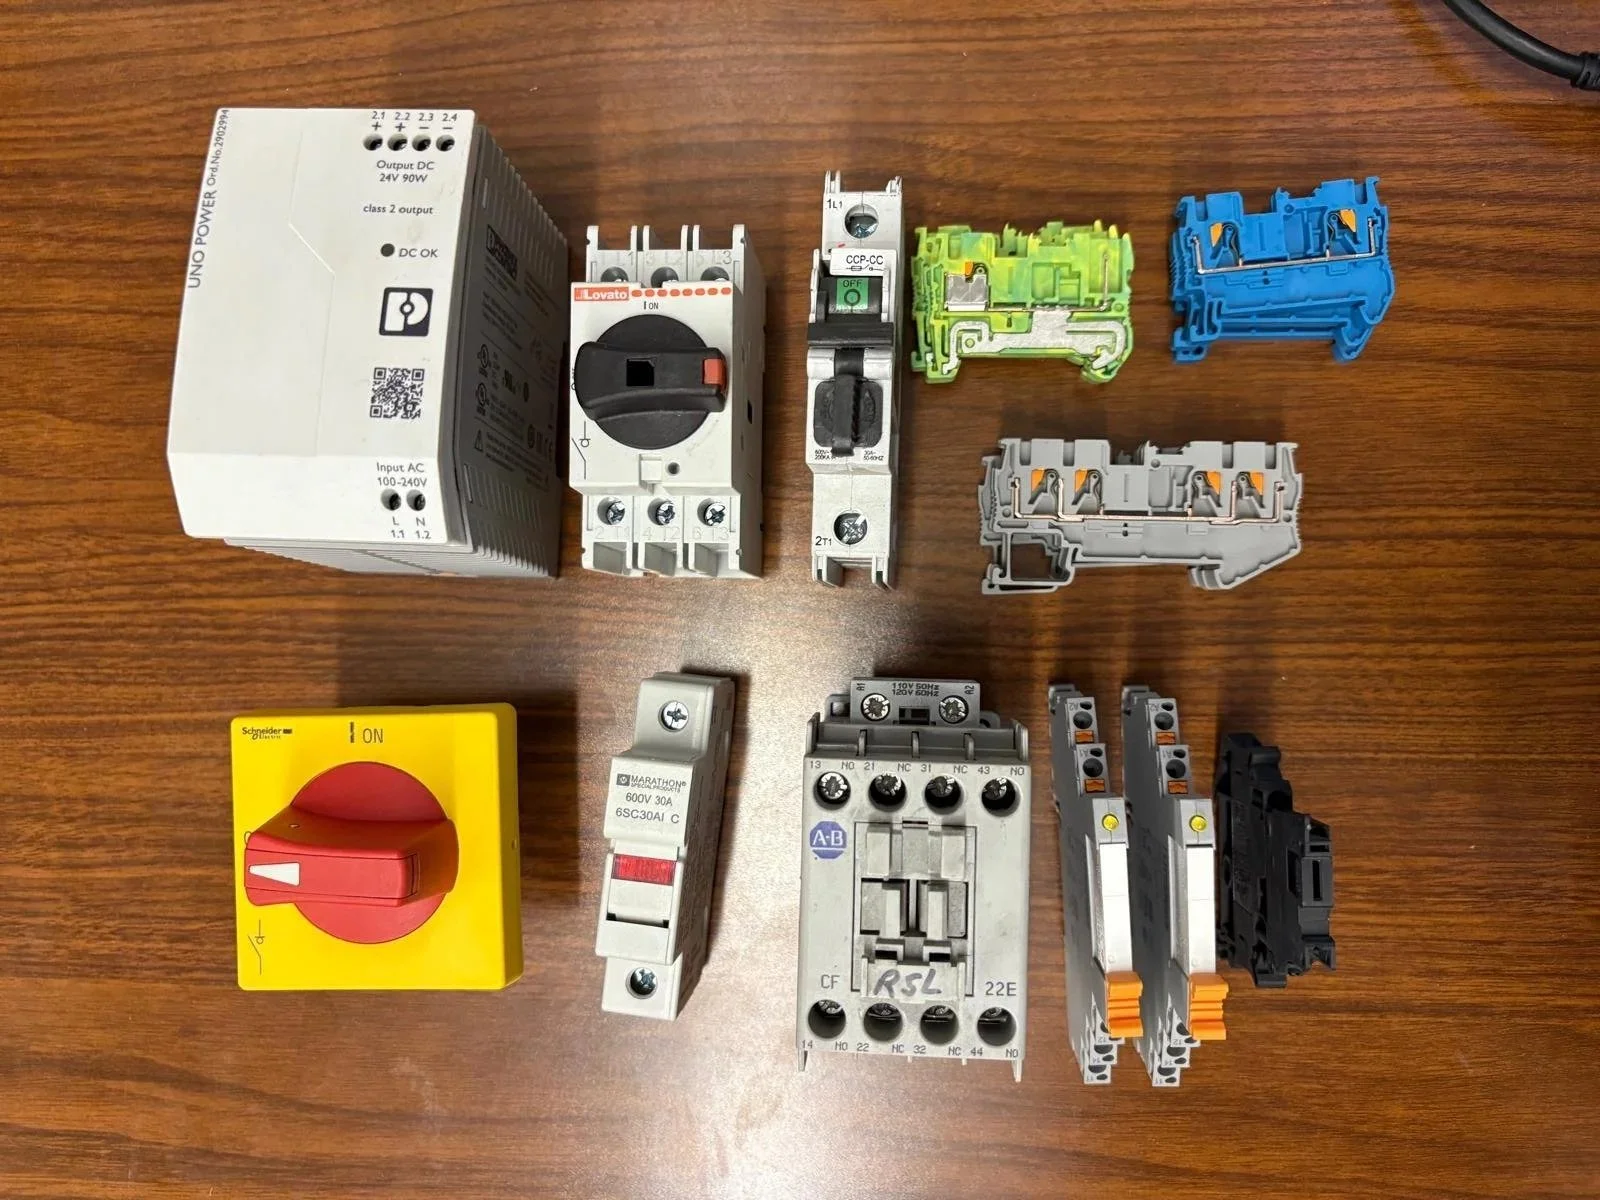
I created a Bill Of Materials for the project and assisted in the ordering of components.
At the end of my co-op period, I transfered the project to a techincian who will assemble the final test fixture.
Objective: Design all electrical wiring and cable routing for a new test fixture that can test three hoists simultaneously and independently. The test fixture must be safe and intuitive to operate.
Method and tools: Complete design created using AutoCAD drawing. I also created a bill of materials and assisted in parts ordering.
Below are the schematic circuit diagrams I designed for the central control panel, the power and control distribution box, and three junction boxes. I included all screw terminals, cabling, and conduit. Click on any of the below images to view the electrical schematic as a PDF.
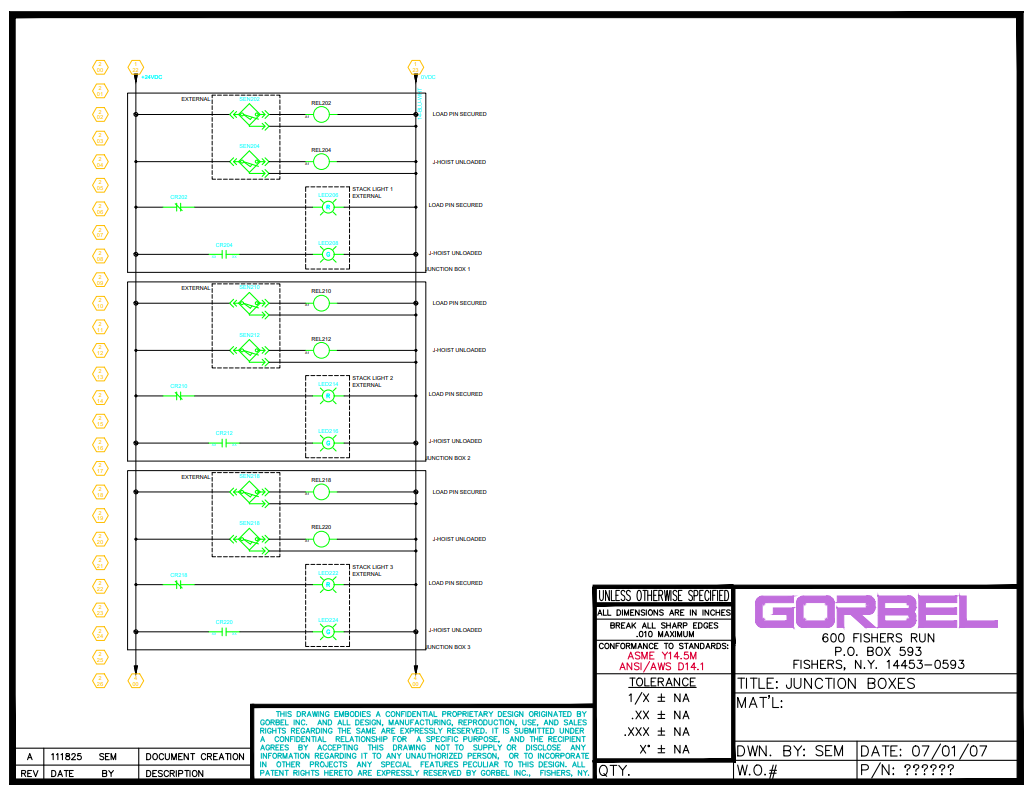
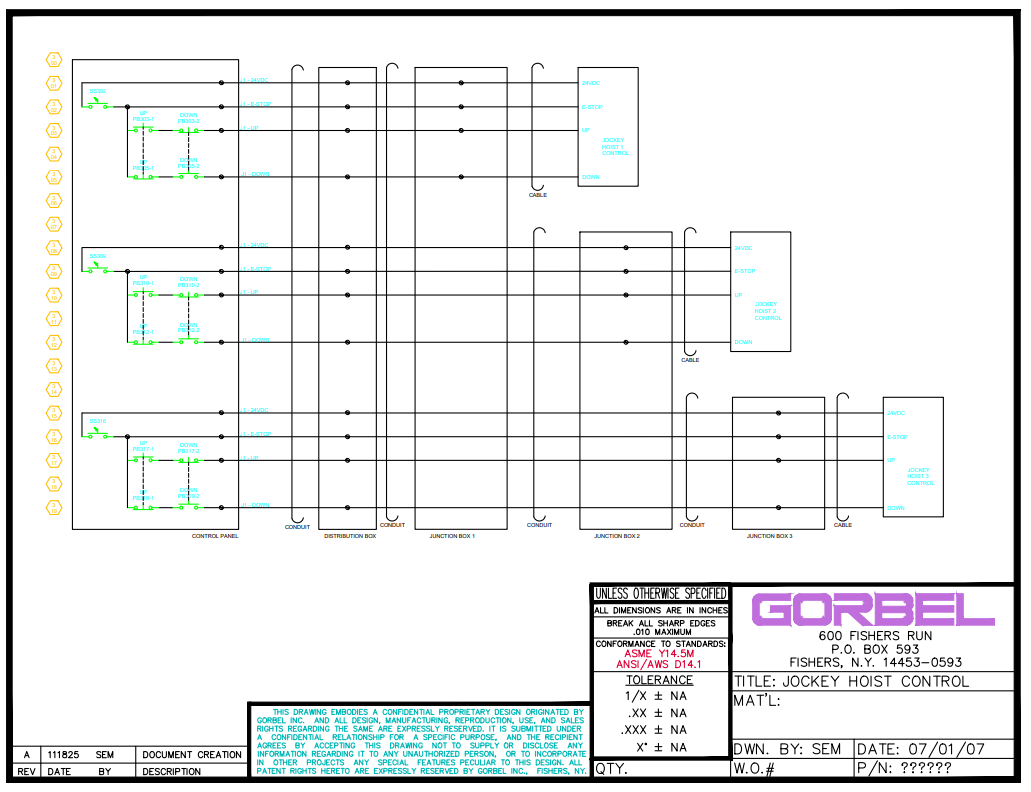
Click image to view as PDF
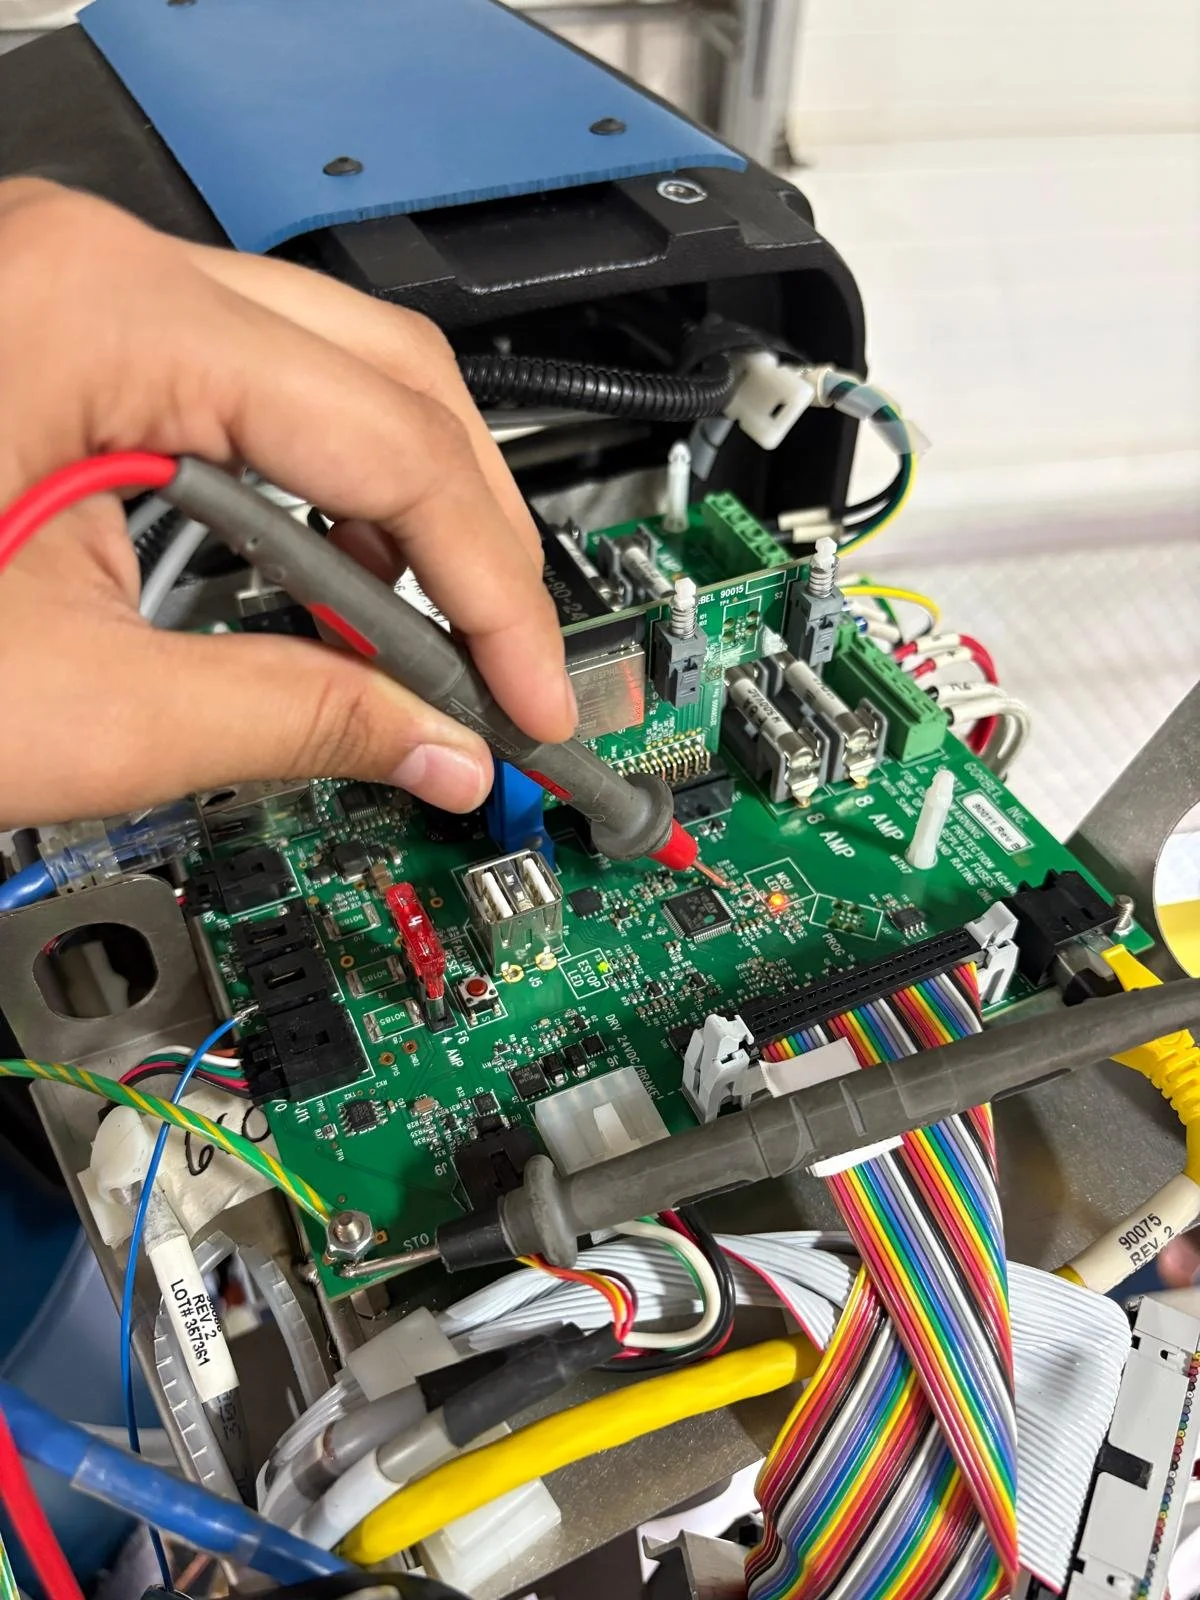
Hoist Benchmark Testing
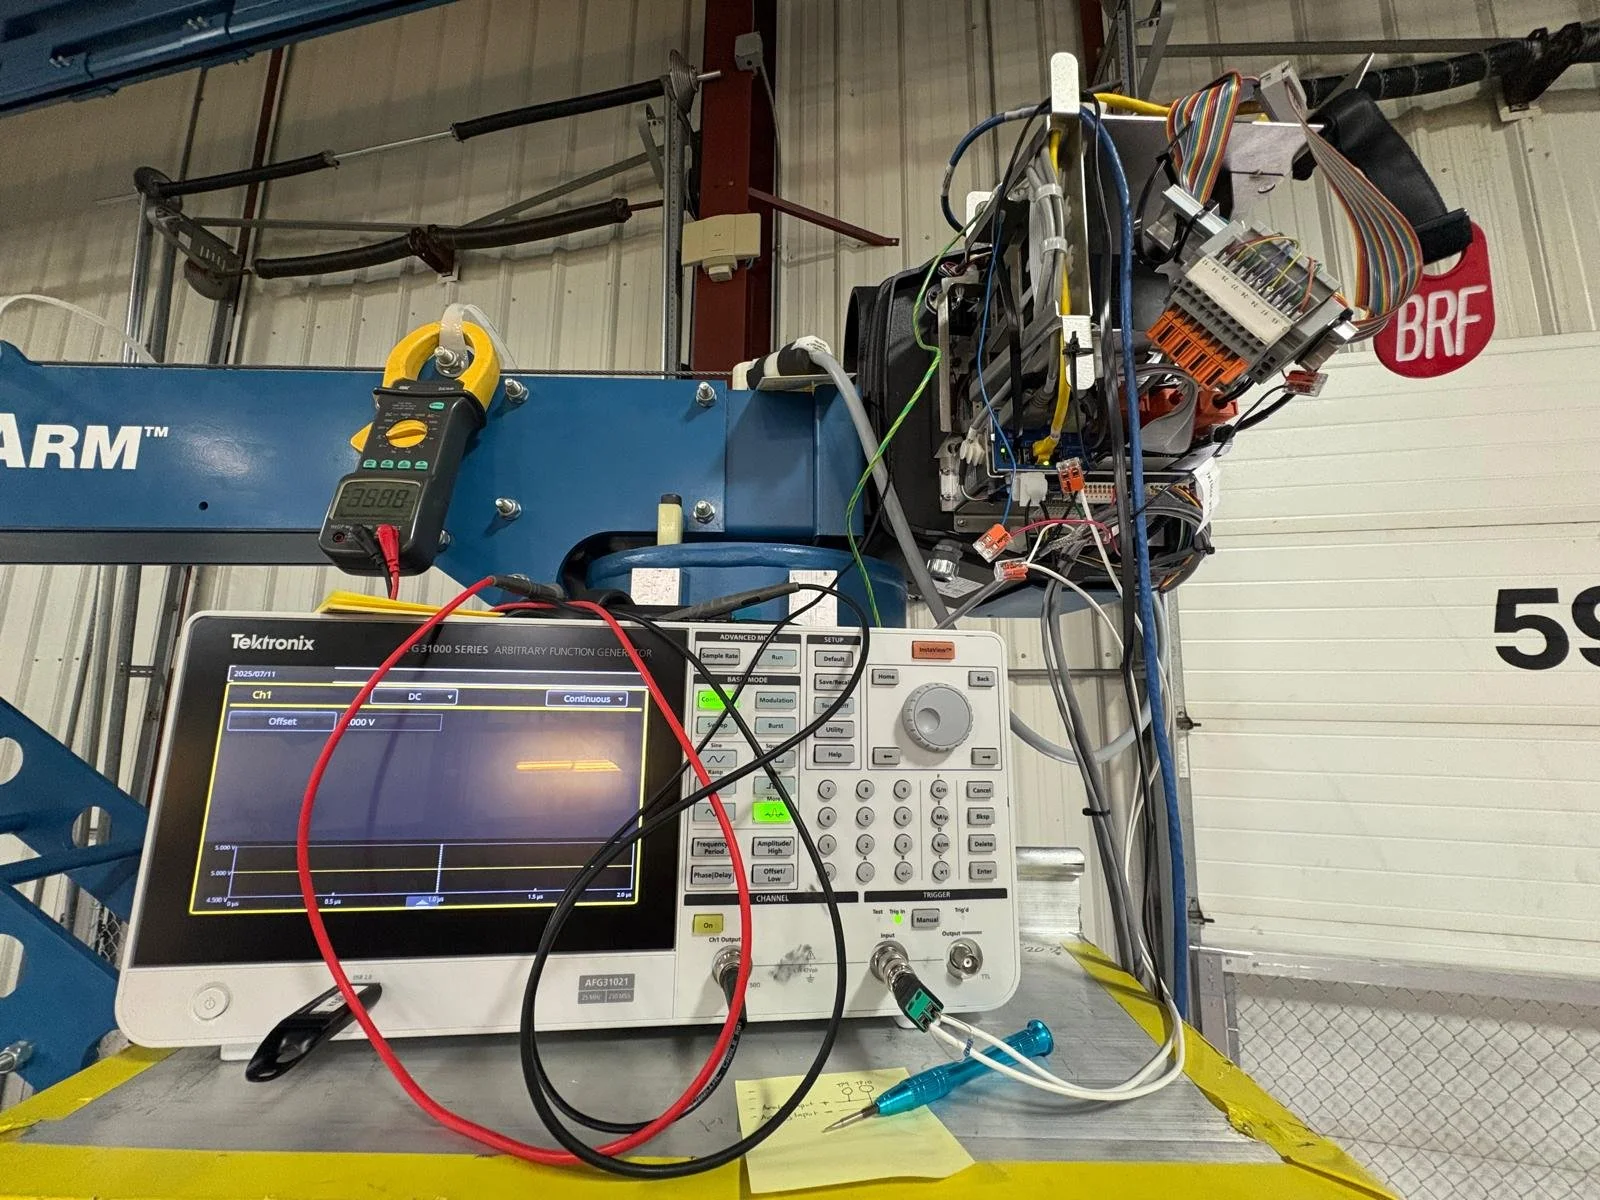
Using the above tools, I executed six test cases on each unit, each with ~50 configurations, collecting data for multiple hoist functionalities across varying speeds, weights, and operating conditions.
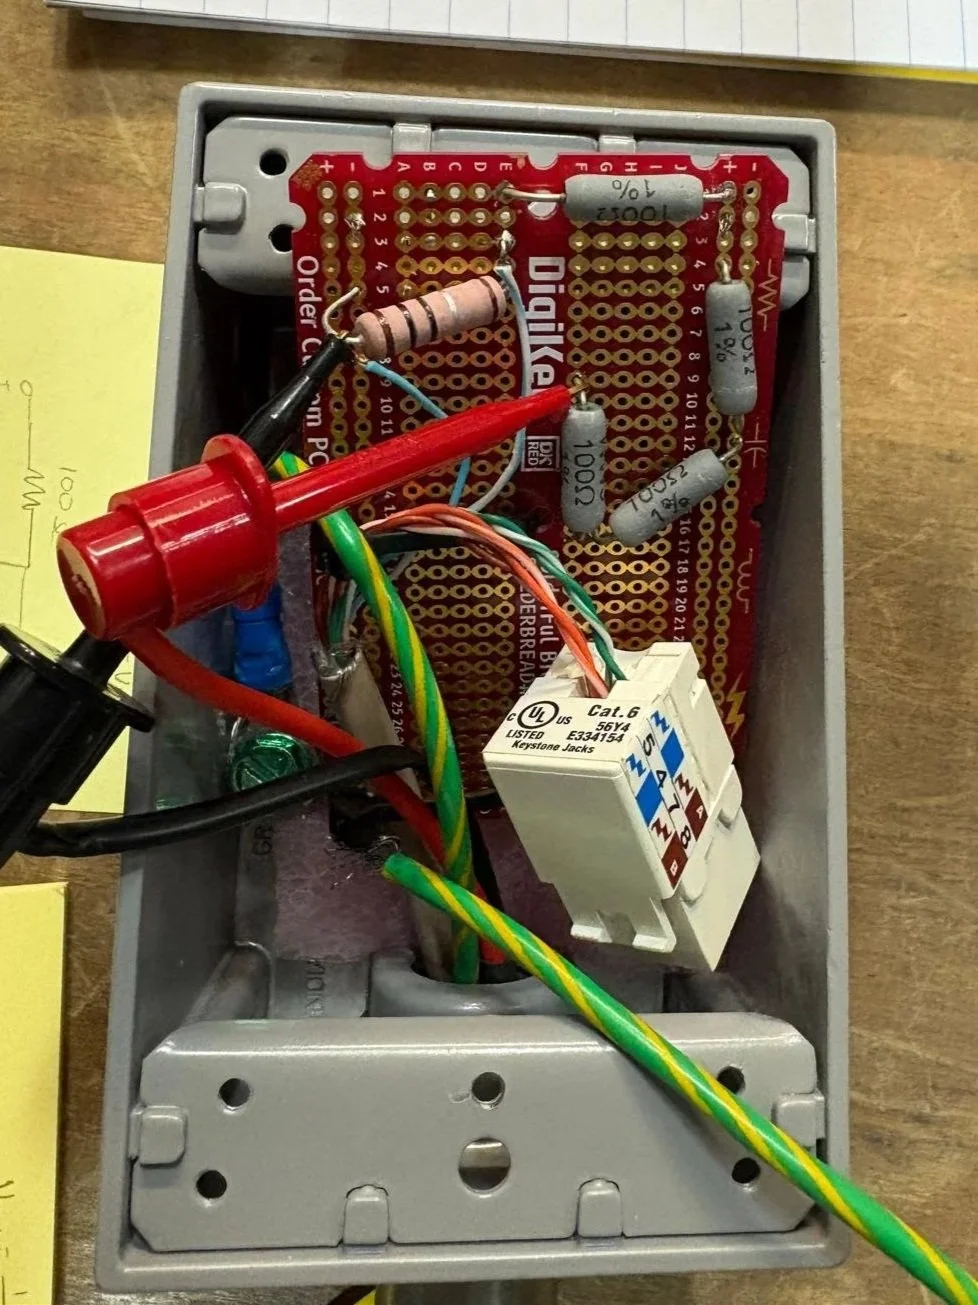
Three of the six test cases required additional circuits, including a voltage divider (right) and signal generator. I designed, wired, and soldered these circuits.
I recorded detailed notes on each test, wrote procedures for each test case, and then taught a technician how to execute each test so he could continue while I moved on to other projects.
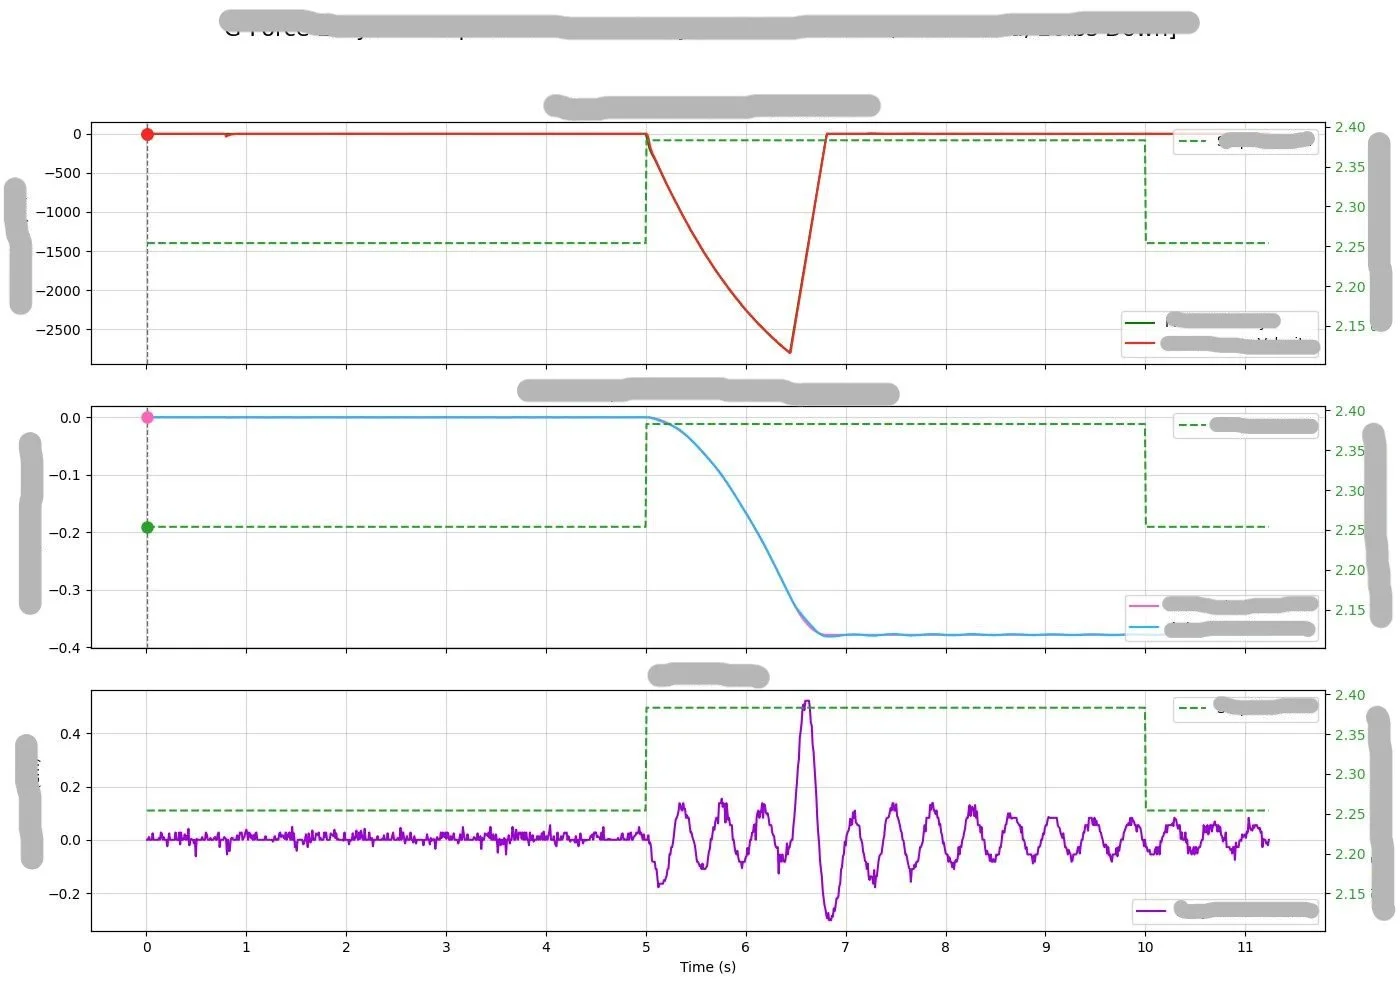
I also wrote a Python program to visualize the data using matplotlib and pandas libraries. My program takes three CSV files, compiles them into one data frame, and creates a set of interactive graphs in a popup display. The user can:
Graph one test case at a time or a whole folder of test cases
Adjust which Y-axes are included
Choose to display and/or save each graph.
The photo on the left shows one of the graphs generated by my program. All labels are redacted to comply with Gorbel’s privacy policy.
Objective: Quantify the handling differences between a new generation of hoist product compared to the legacy equipment.
Method and tools: Use a signal generator, oscilloscope, distance sensor, servo drive setup and diagnostics tool, to execute tests and collect data. The exact methods are omitted here to comply with Gorbel’s privacy policy.