UR Baja SAE
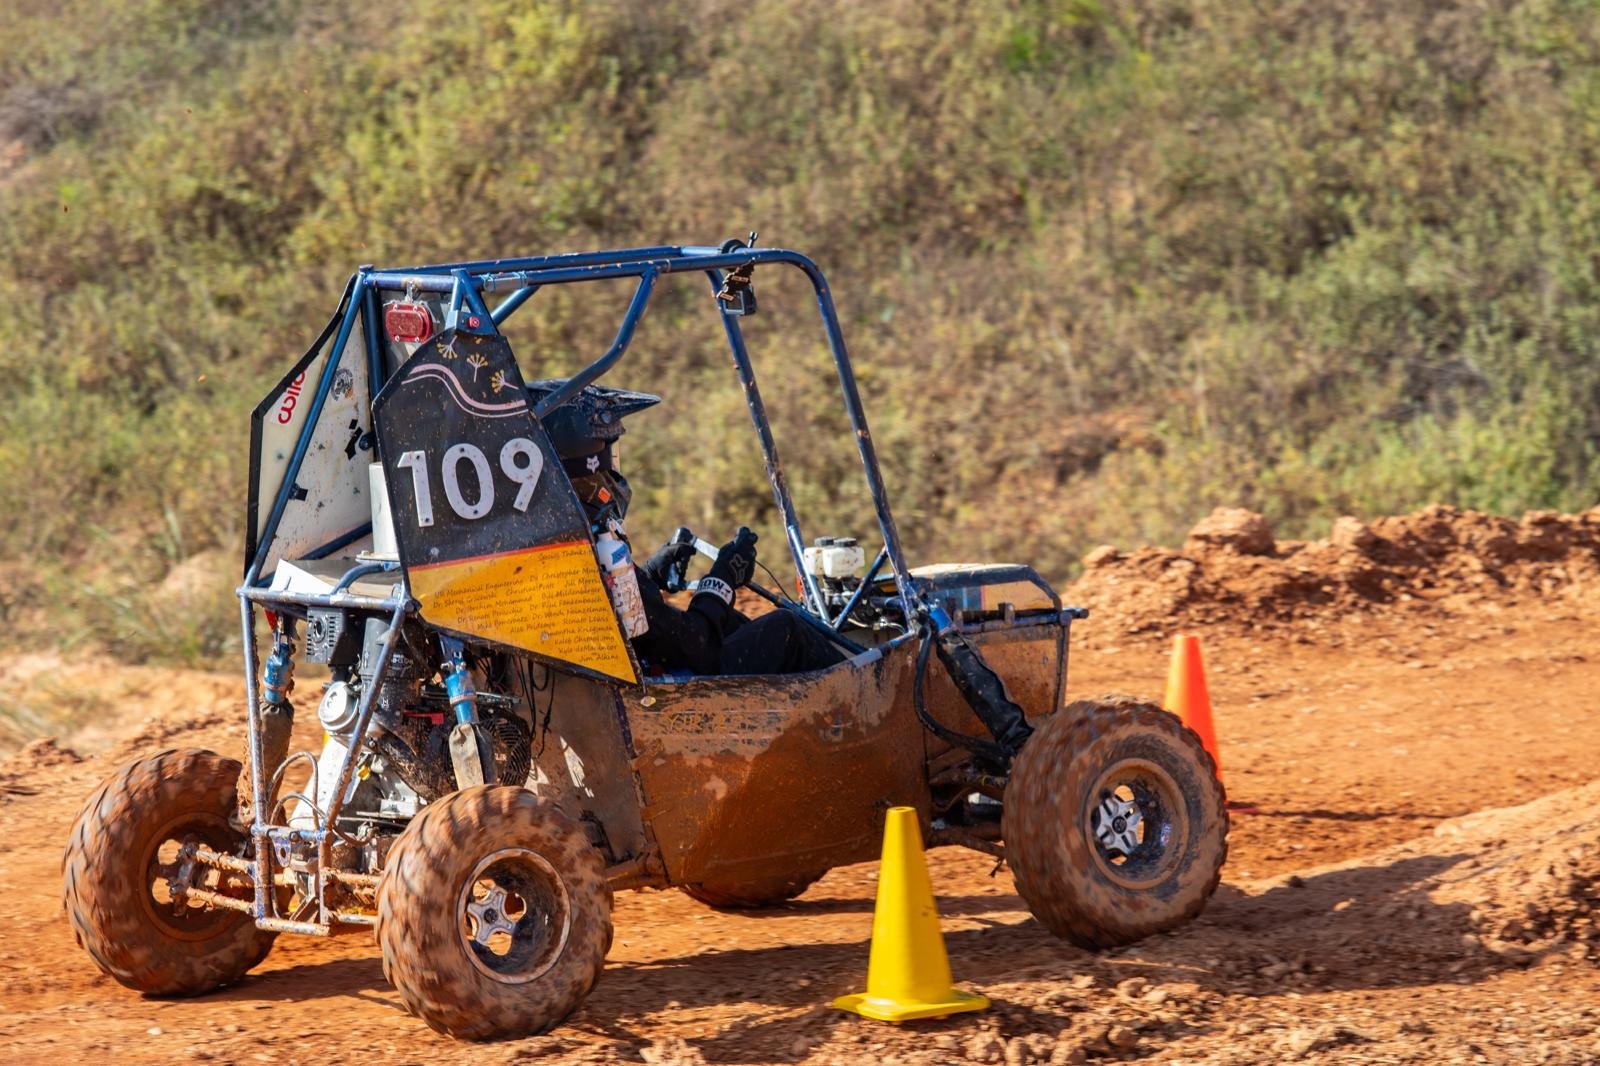
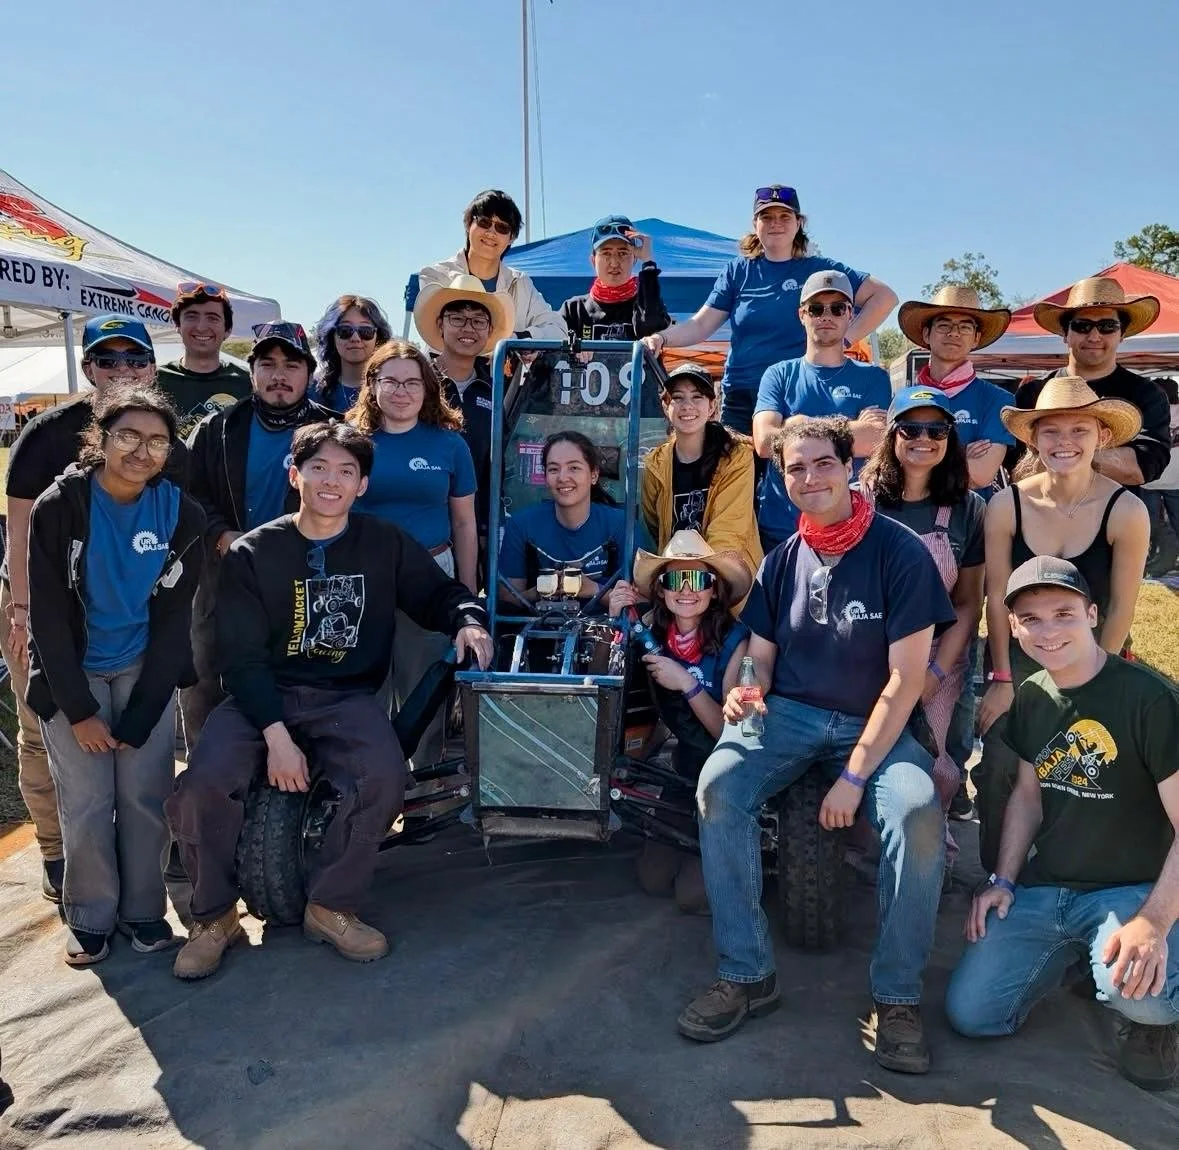
Baja SAE is an international collegiate design competition where teams design, build, test, and race a single-seater off-road vehicle. Between May 2024 to October 2025, our team improved from the bottom 30% to the top 40% of competiting schools.
CVT Shift Curve
(in progress)
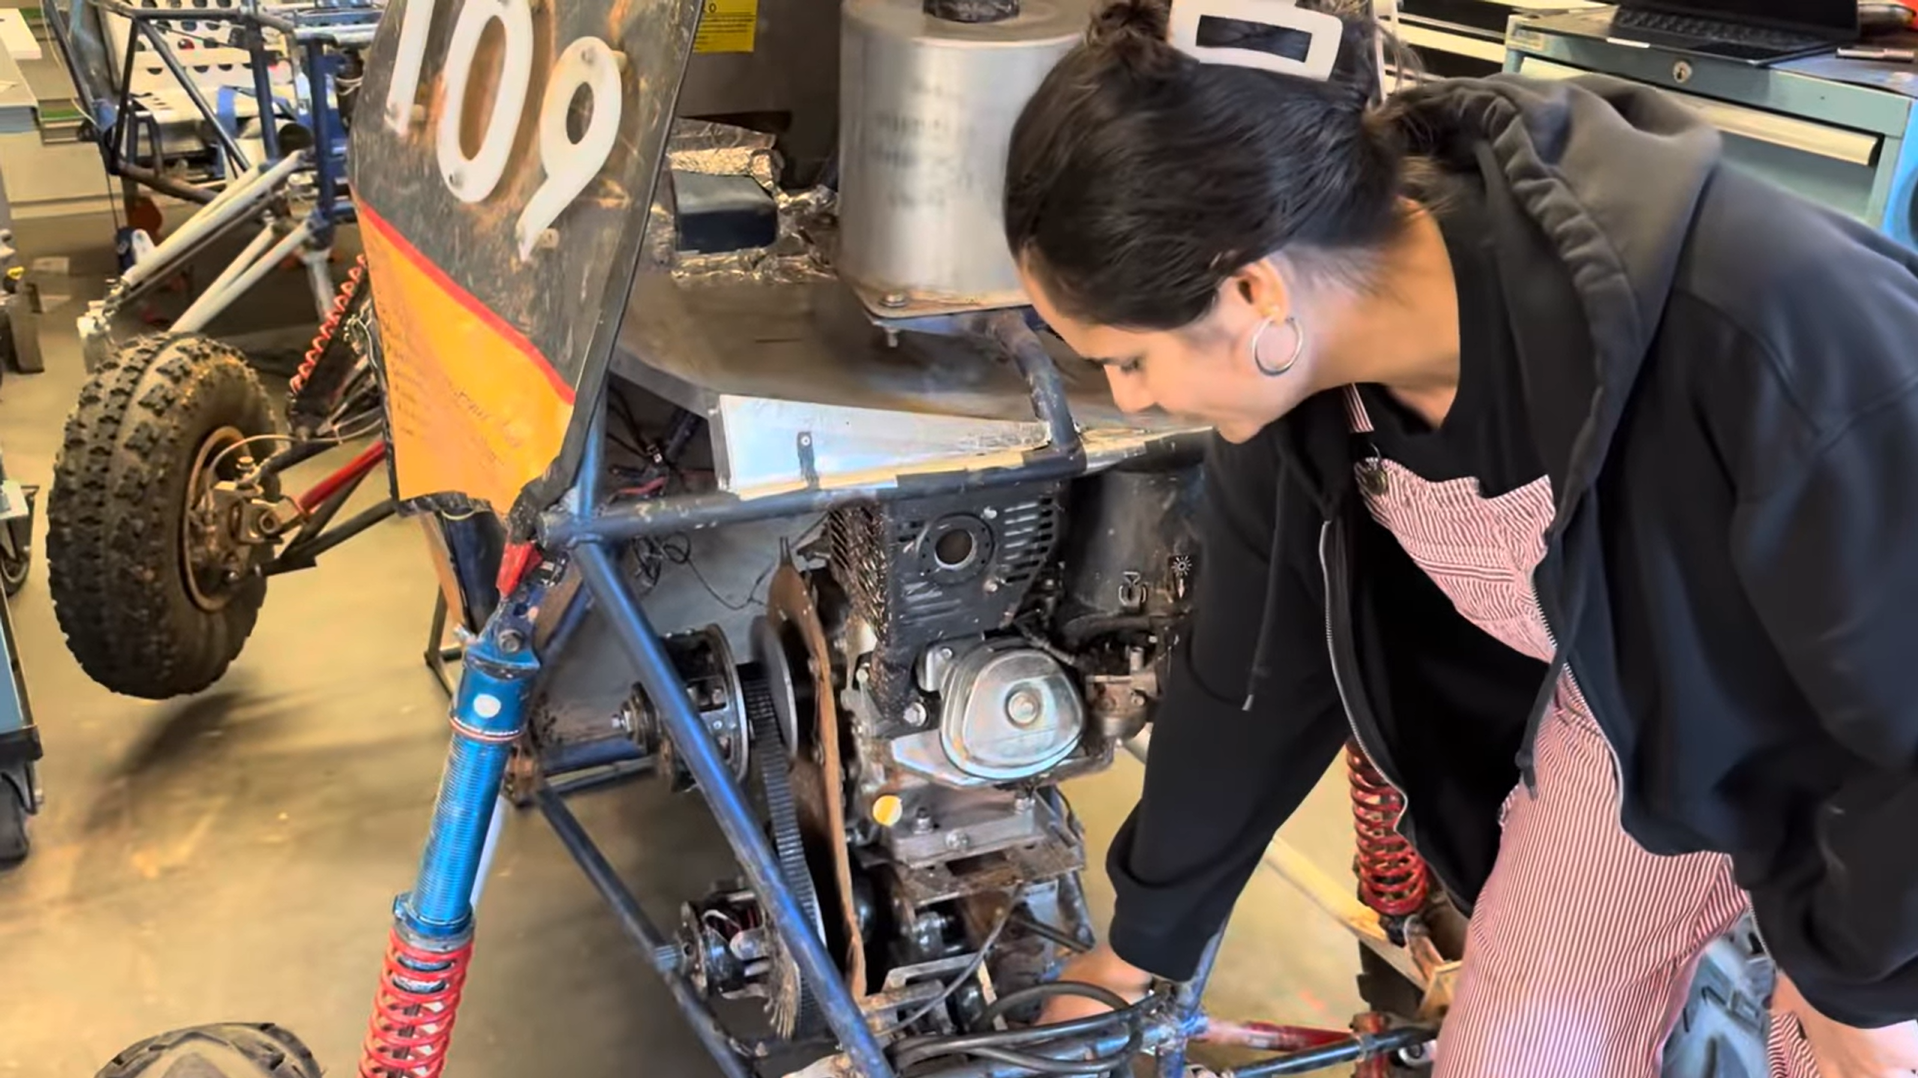
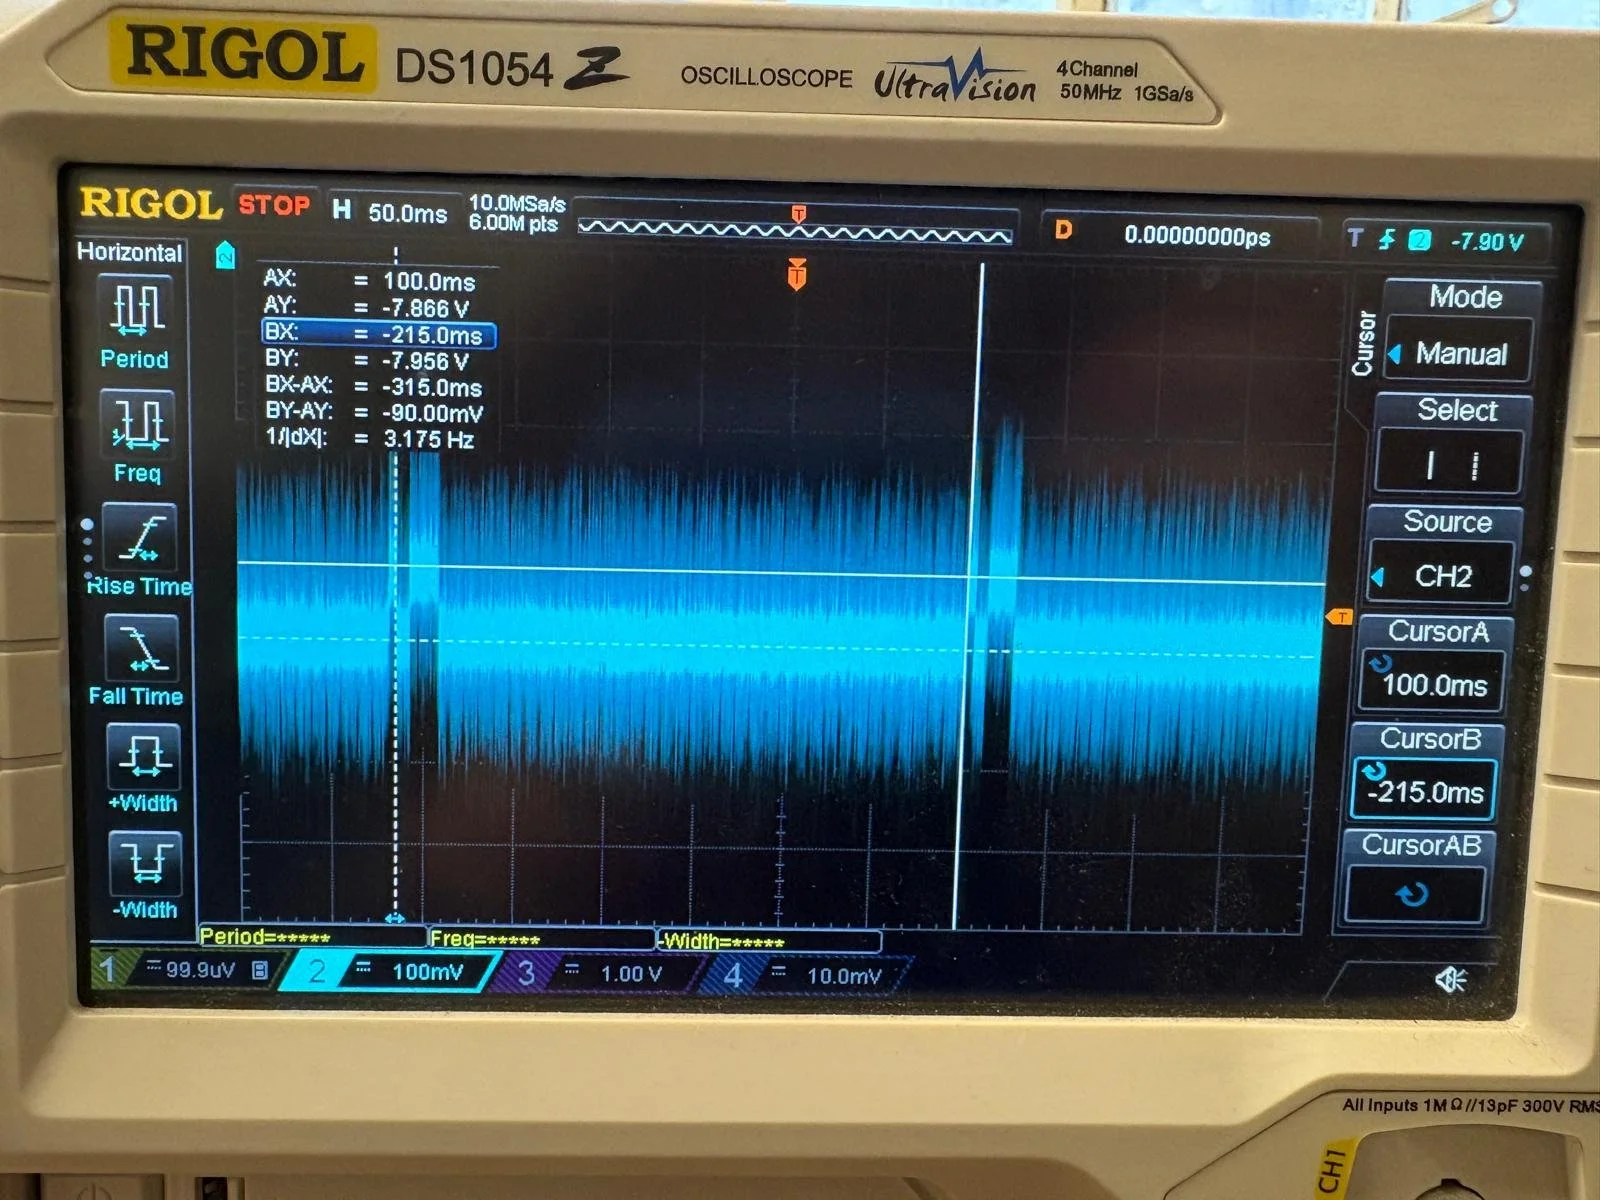
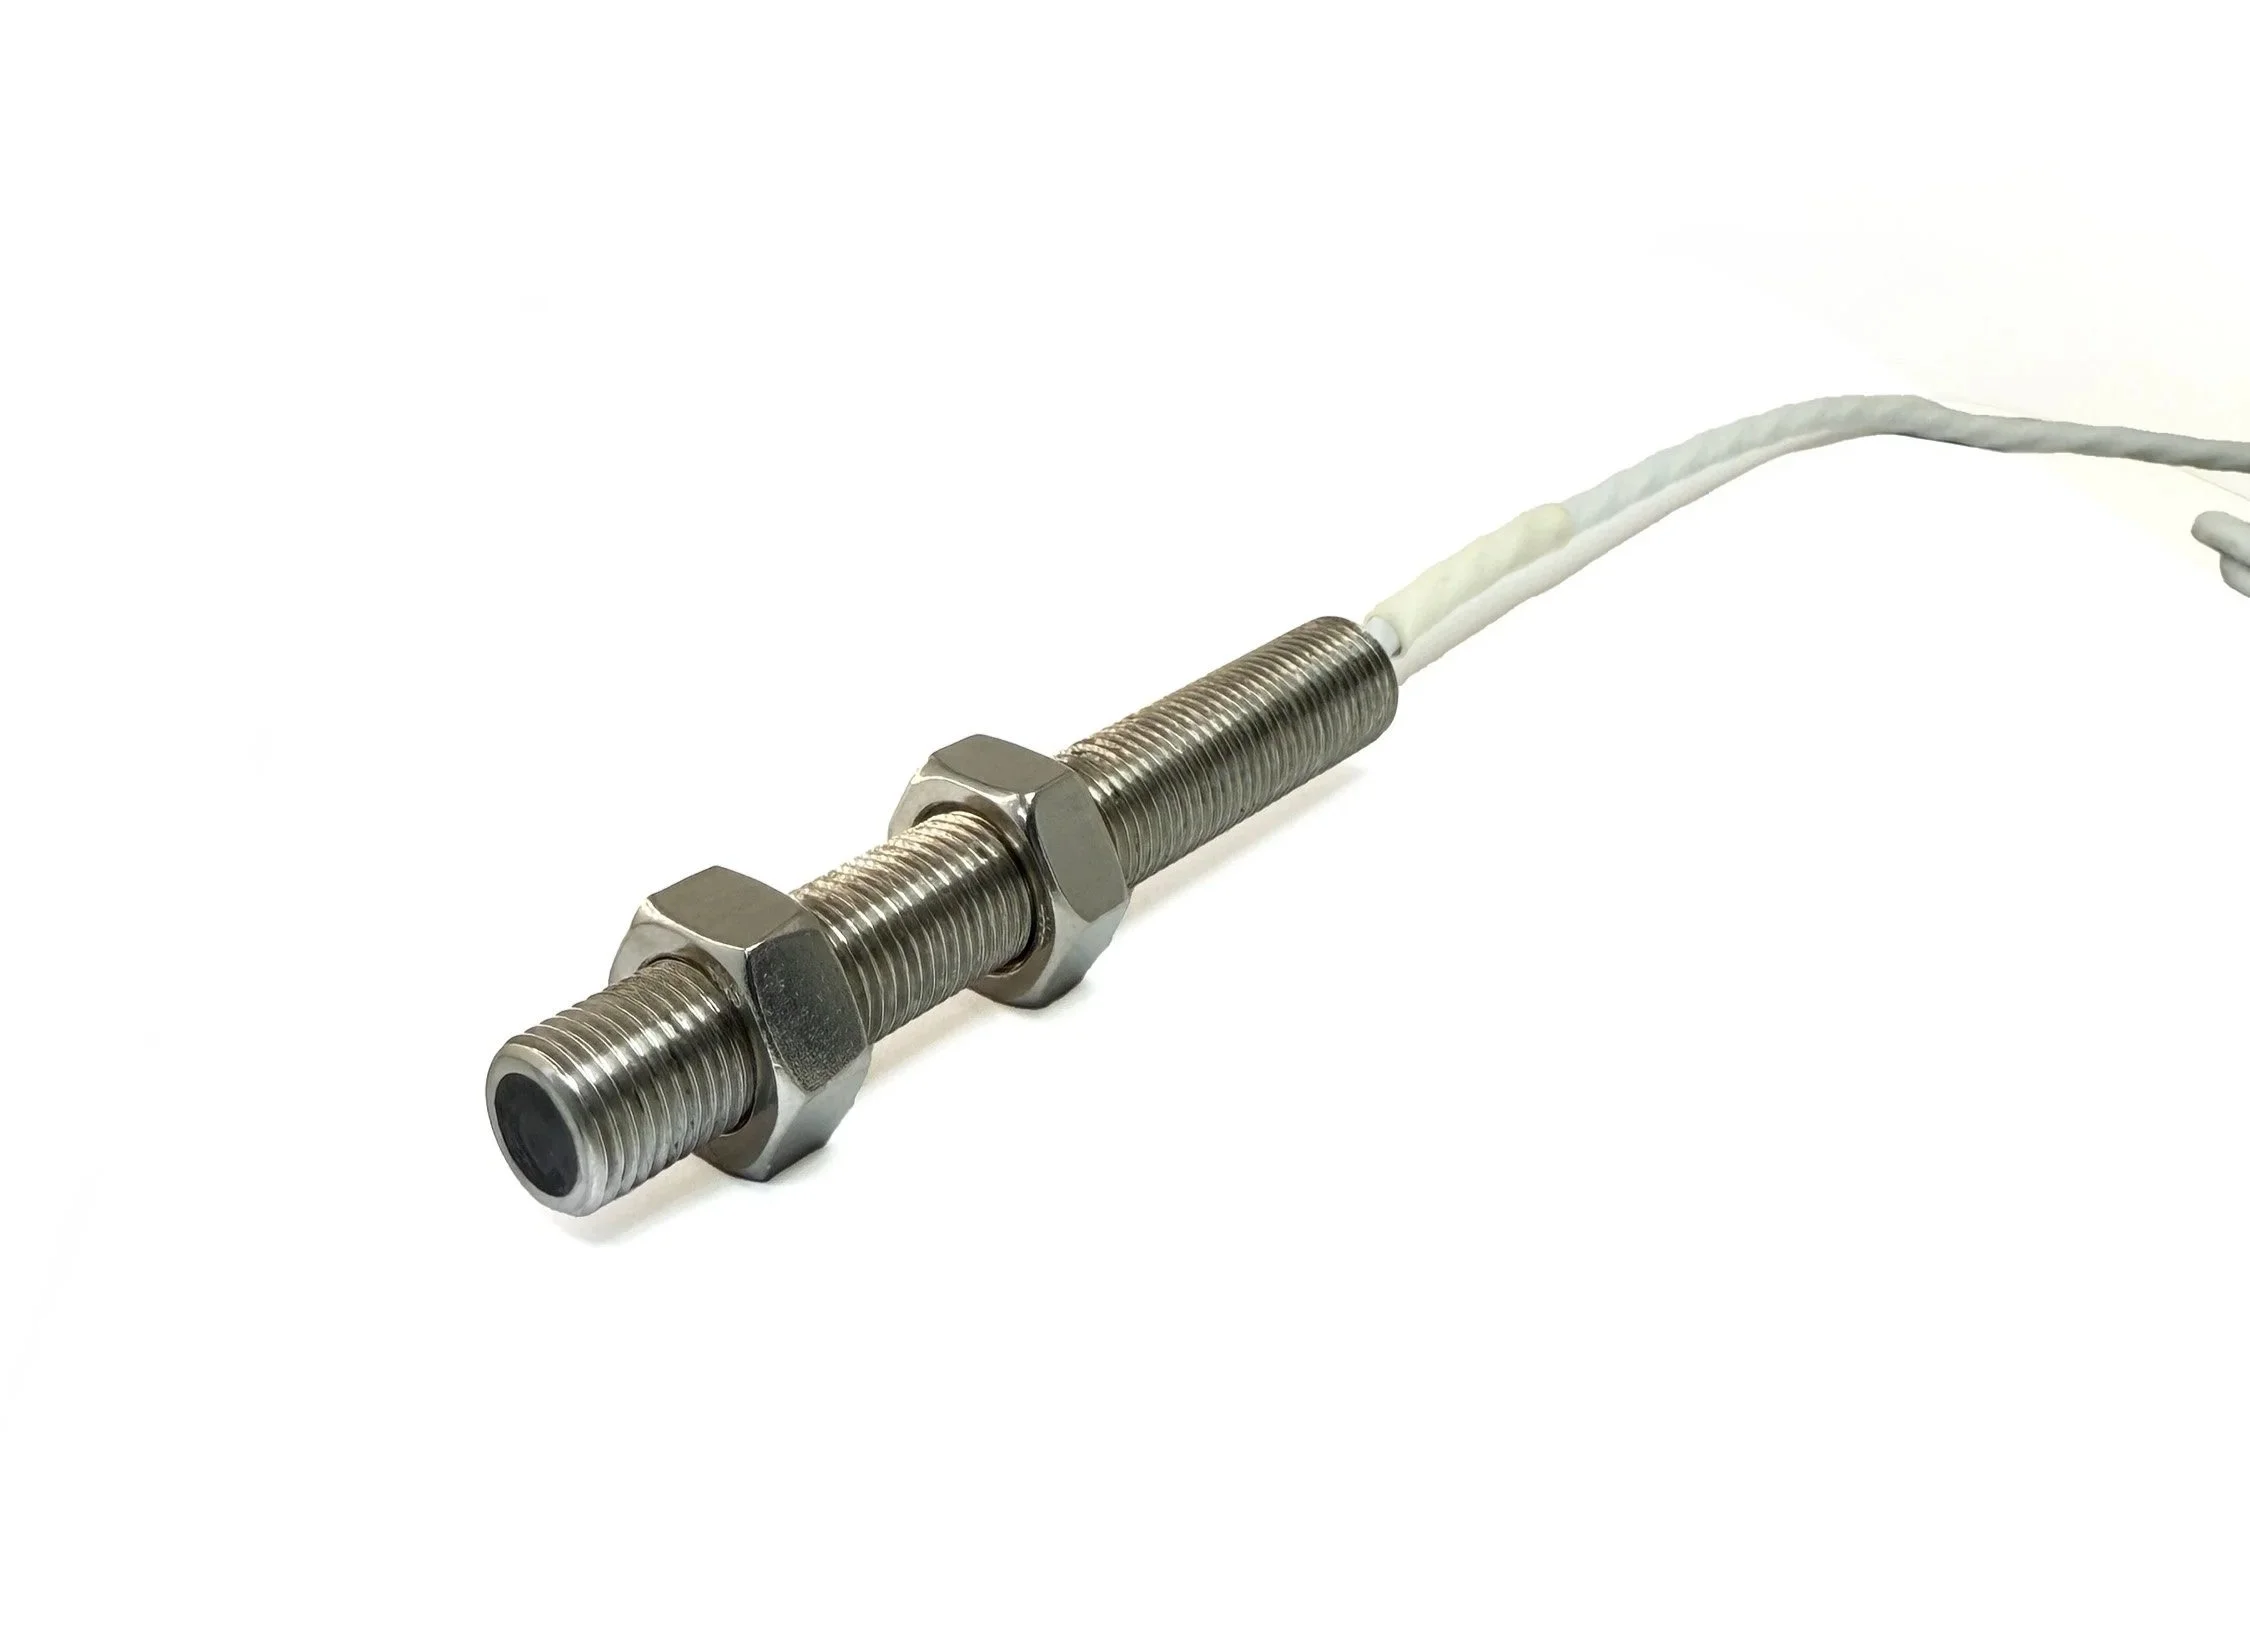
I worked with a few teammates to set up a test fixture to point an older hall effect sensor towards the primary pulley on the lathe and test the sensing distance and signal. We learned that the maximum sensing distance increases if the hall effect is pointed towards a magnet instead of steel, and that electrical noise is a significant challenge.
I also created and compiled a set of training materials for the new members so they could understand the purpose and methods for the shift curve testing. Attached is a video I made with the CVT lead, and a training document with definitions, tools, and plans.
My part starts at timestamp 2:35.
Working with one other teammate, we are writing the Teensy microcontroller code for data collection, and the MATLAB code for data analysis and graphing.
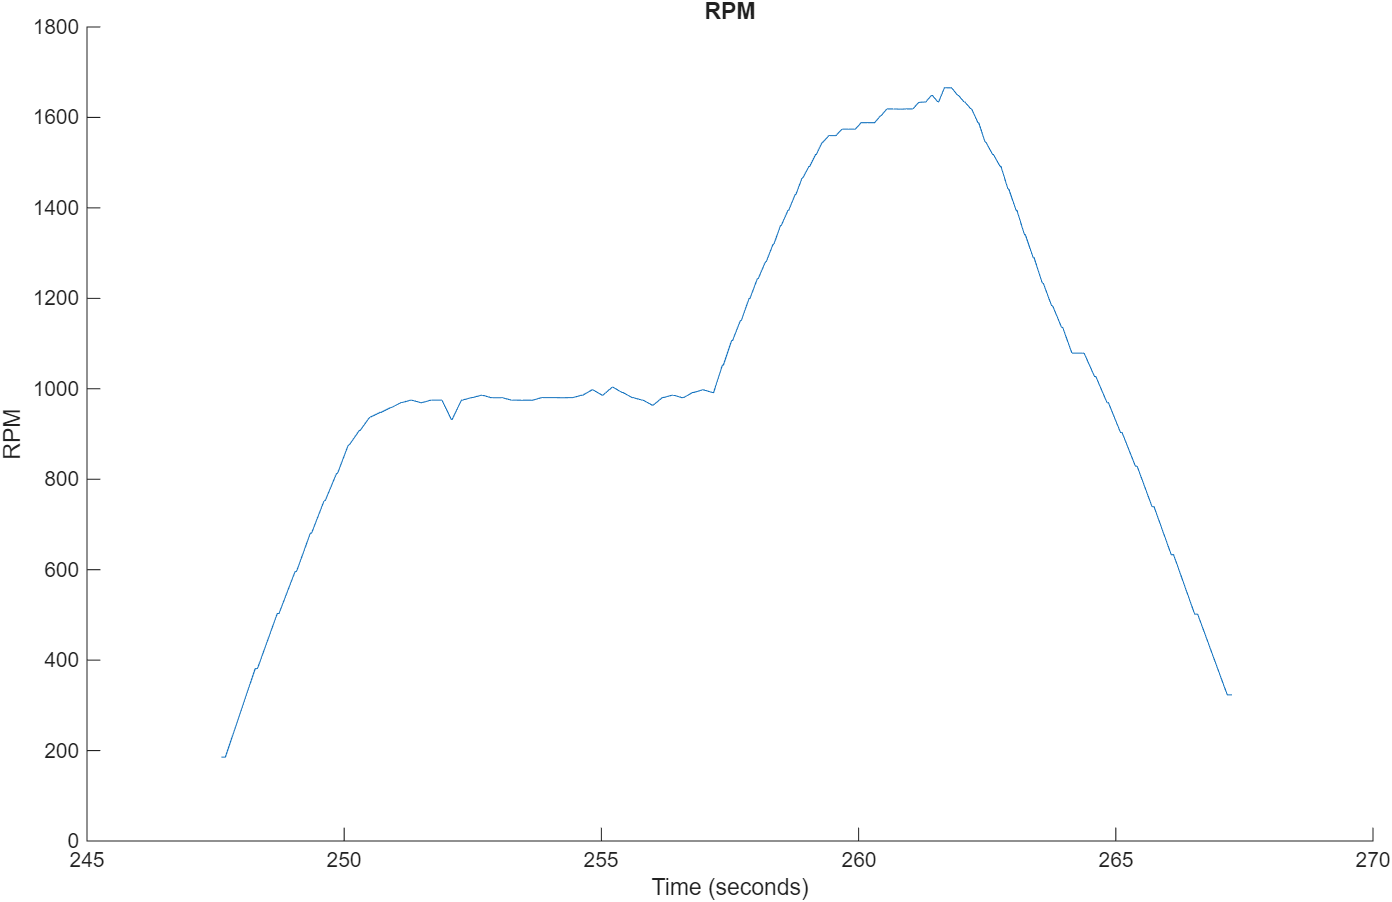
Objective: Create an electronic system to collect a shift curve graph for the Continuously Variable Transmission during an acceleration run.
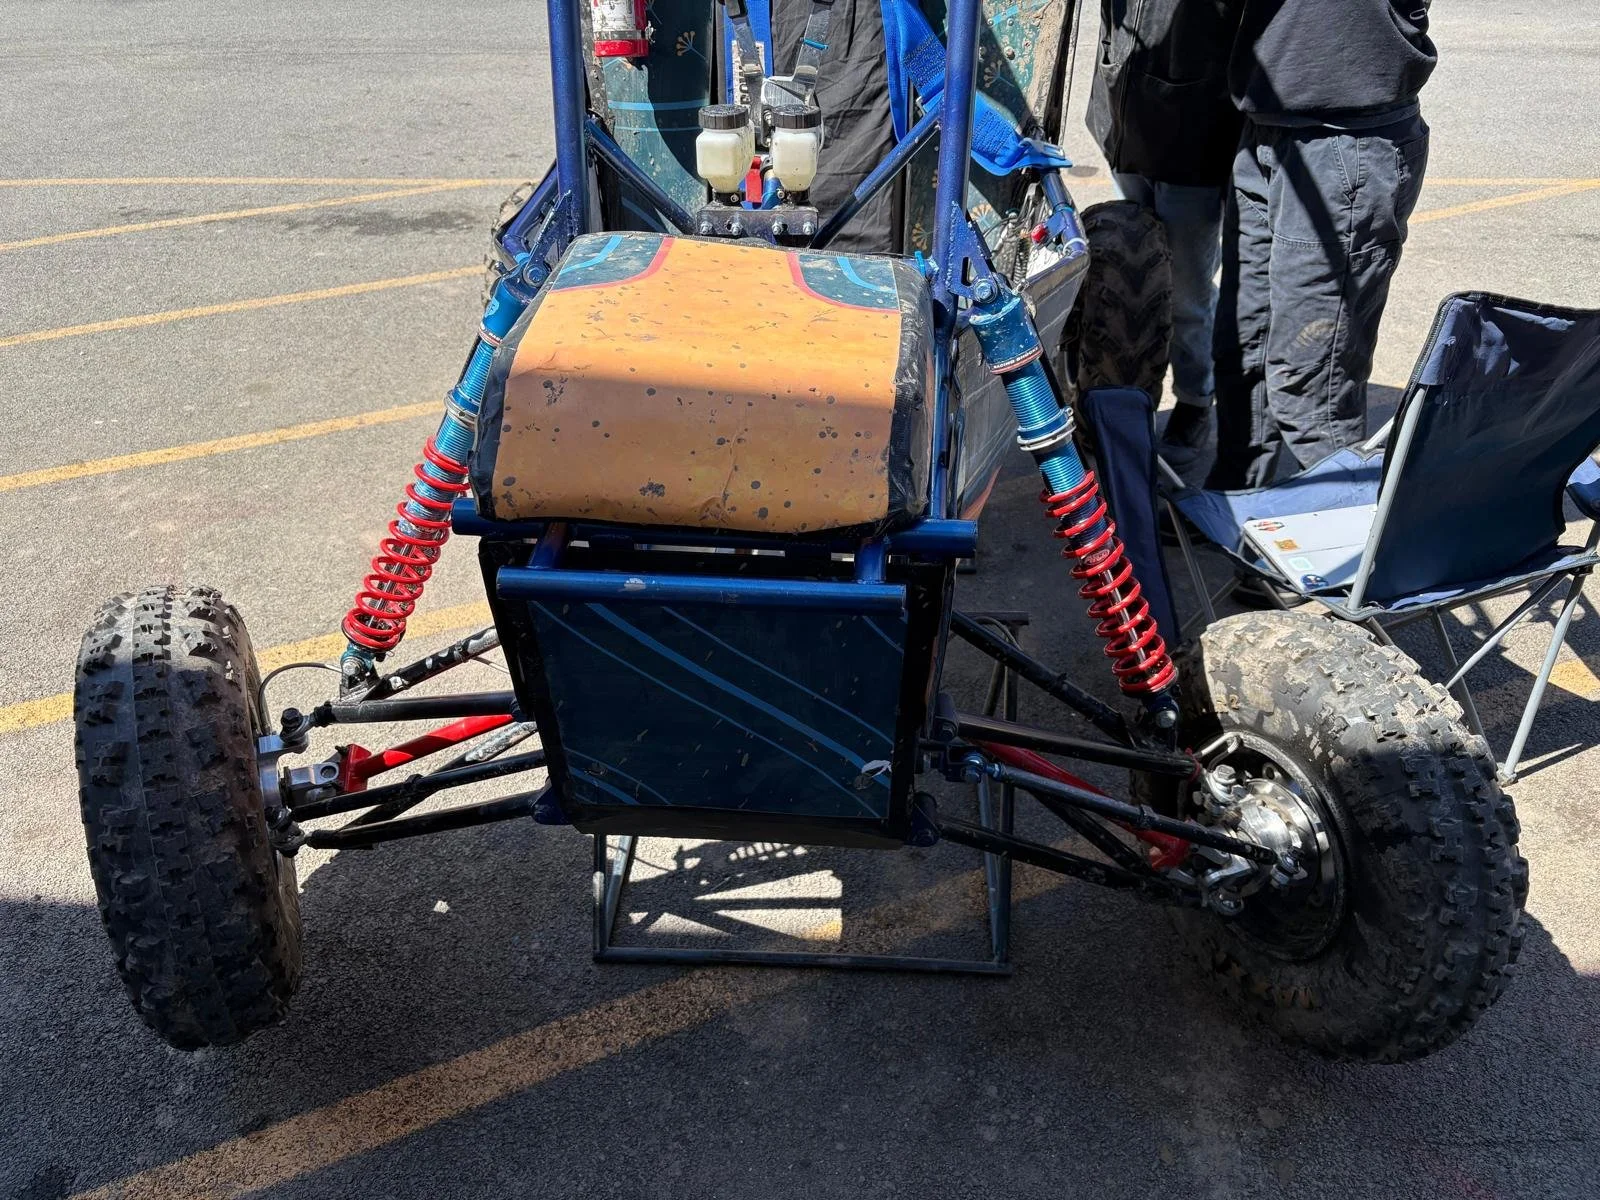
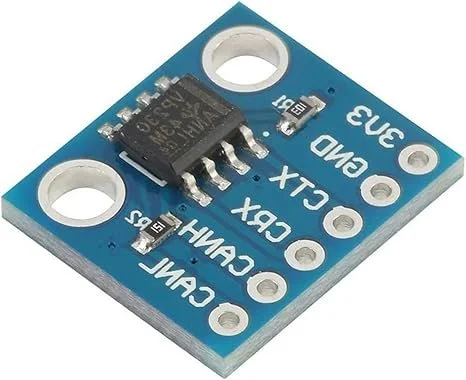
Method and tools: Mount two variable reluctance sensors, one measuring signal from a magnet on the primary pulley of the CVT, and the other measuring signal from a magnetic shaft collar on the gearcase output shaft. Both send signals via CAN bus transmission to a data collection box that includes signal modifying circuits and a Teensy 4.1 microcontroller. The Teensy tabulates the signals from each sensor, saving to a CSV file on an SD card. After all data is collected, run a MATLAB script to interpret and graph the data, creating a shift curve.
This data collection system is not yet complete, but below I will describe the progress we have made so far.
Delegated projects:
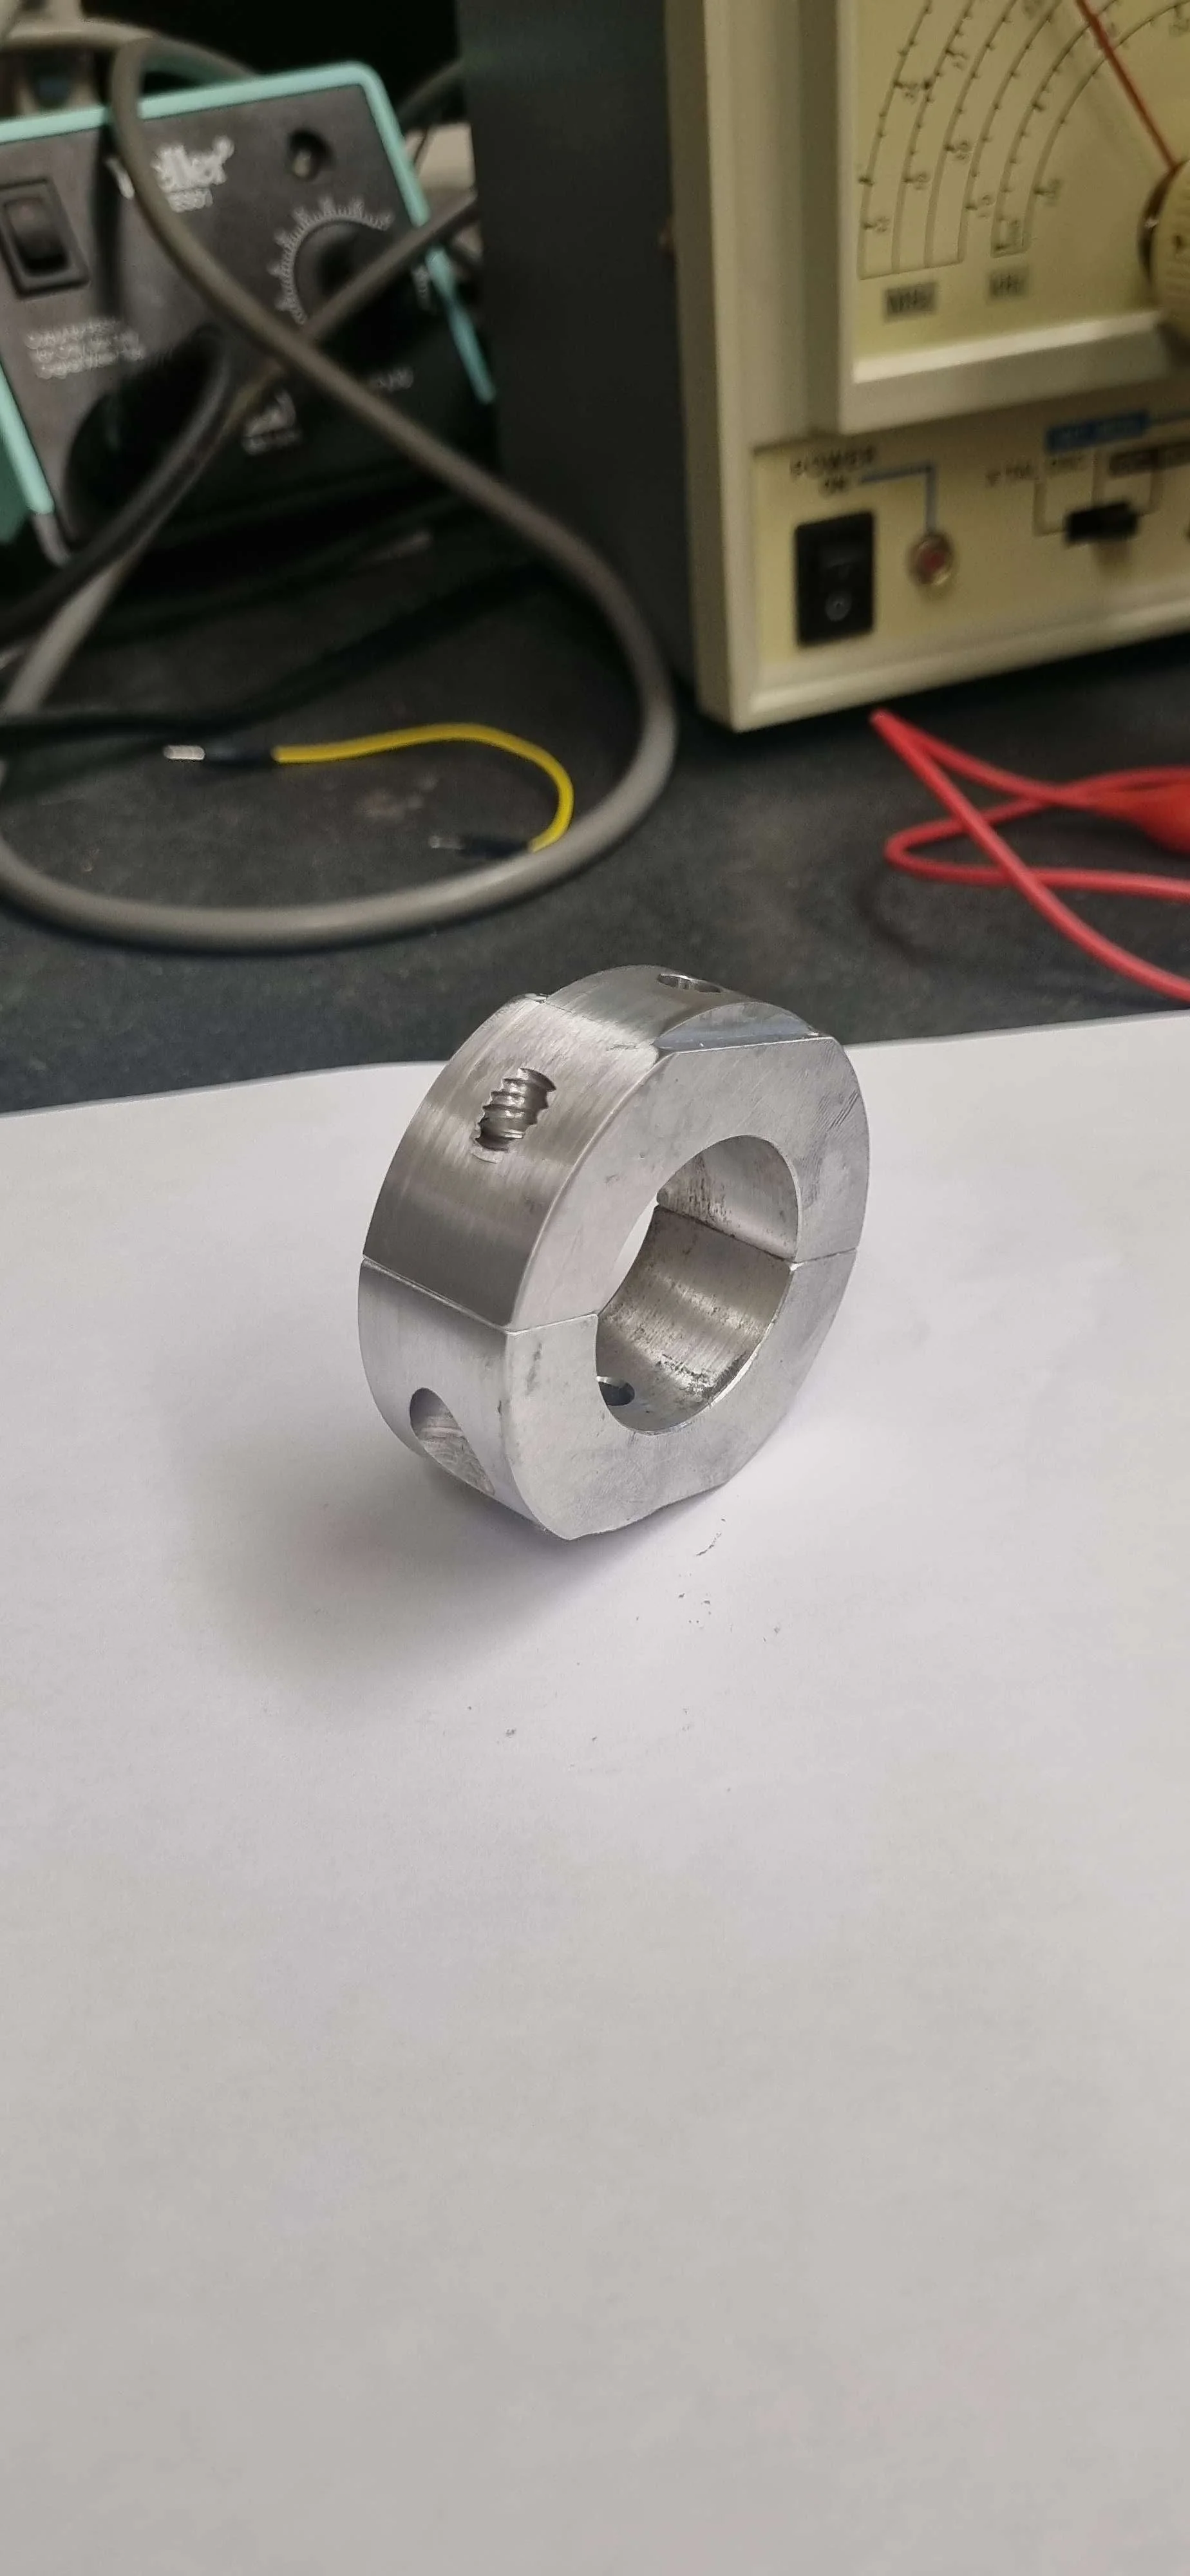
creating a shaft collar for the output shaft that holds magnets for the variable reluctance sensor to point to
Creating mounts for each of the variable reluctance sensors
Researching CAN bus capabilities
Steering Subsystem
From May 2024 to April 2025, I was the steering subsystem lead for our team. This means I oversaw all design, manufacturing, and assembly of the steering subsystem.
Requirements & Specifications
High Level Goal: Robustness
No interference with upper a-arms
Outer turning radius: 11 feet
Butterfly steering - lock to lock steering is 180 degrees
Front tire maximum rotations = 28 degrees outer tire
Rack movement amplitude = 1.57 in
Steering link adjustment +- 1 in
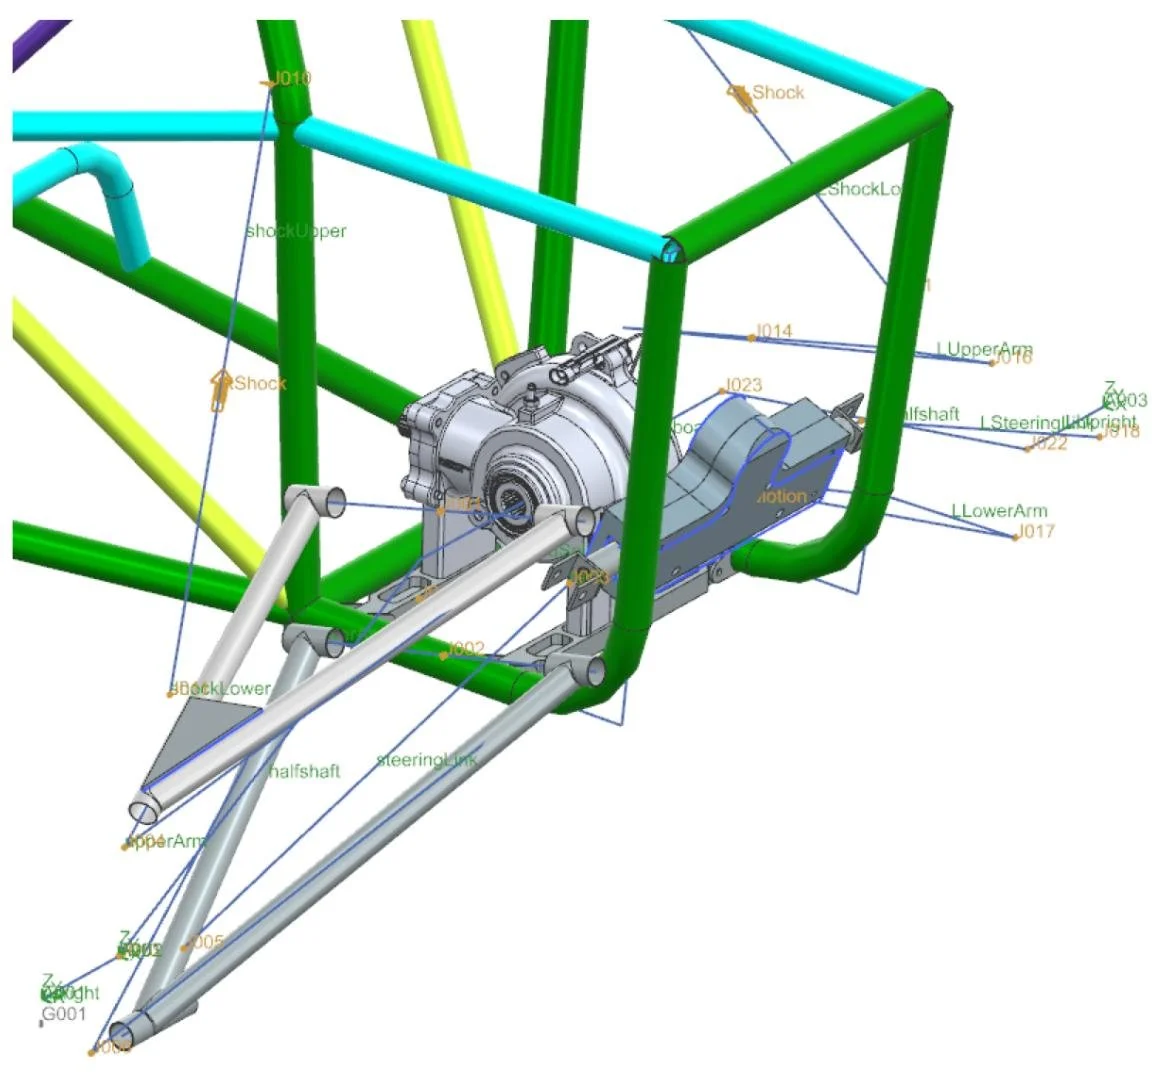
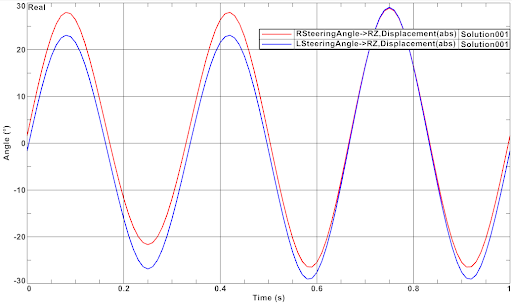
To start the design, I worked closely with the suspension lead to create a kinematic motion model in Nx. We included the geometry and joints between each component, and then simulated the shocks over the full range of motion. The left image shows the simulation setup. The right image shows the left and right tire angles over the full range of motion of the steering wheel and the shocks.
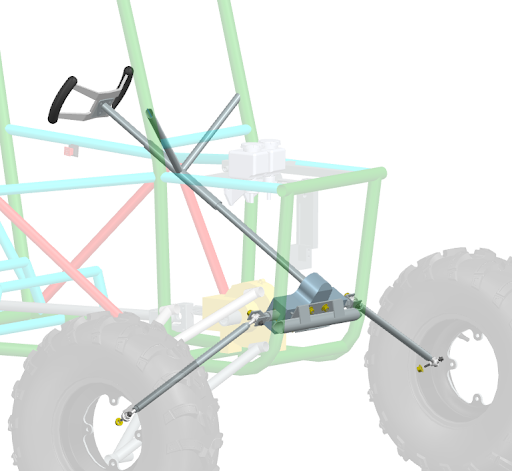
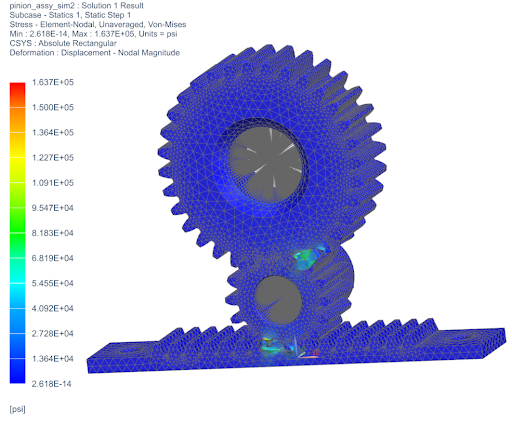
After deciding on the geometry for all of the mounting points, I designed and assembled a complete CAD of the subsystem (left). I also ran FEAs on susceptible components. The right image shows the FEA results for the steering gear system.
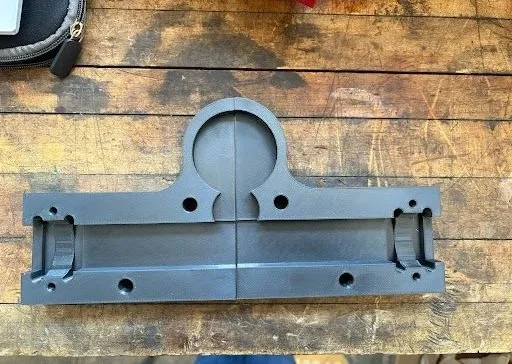
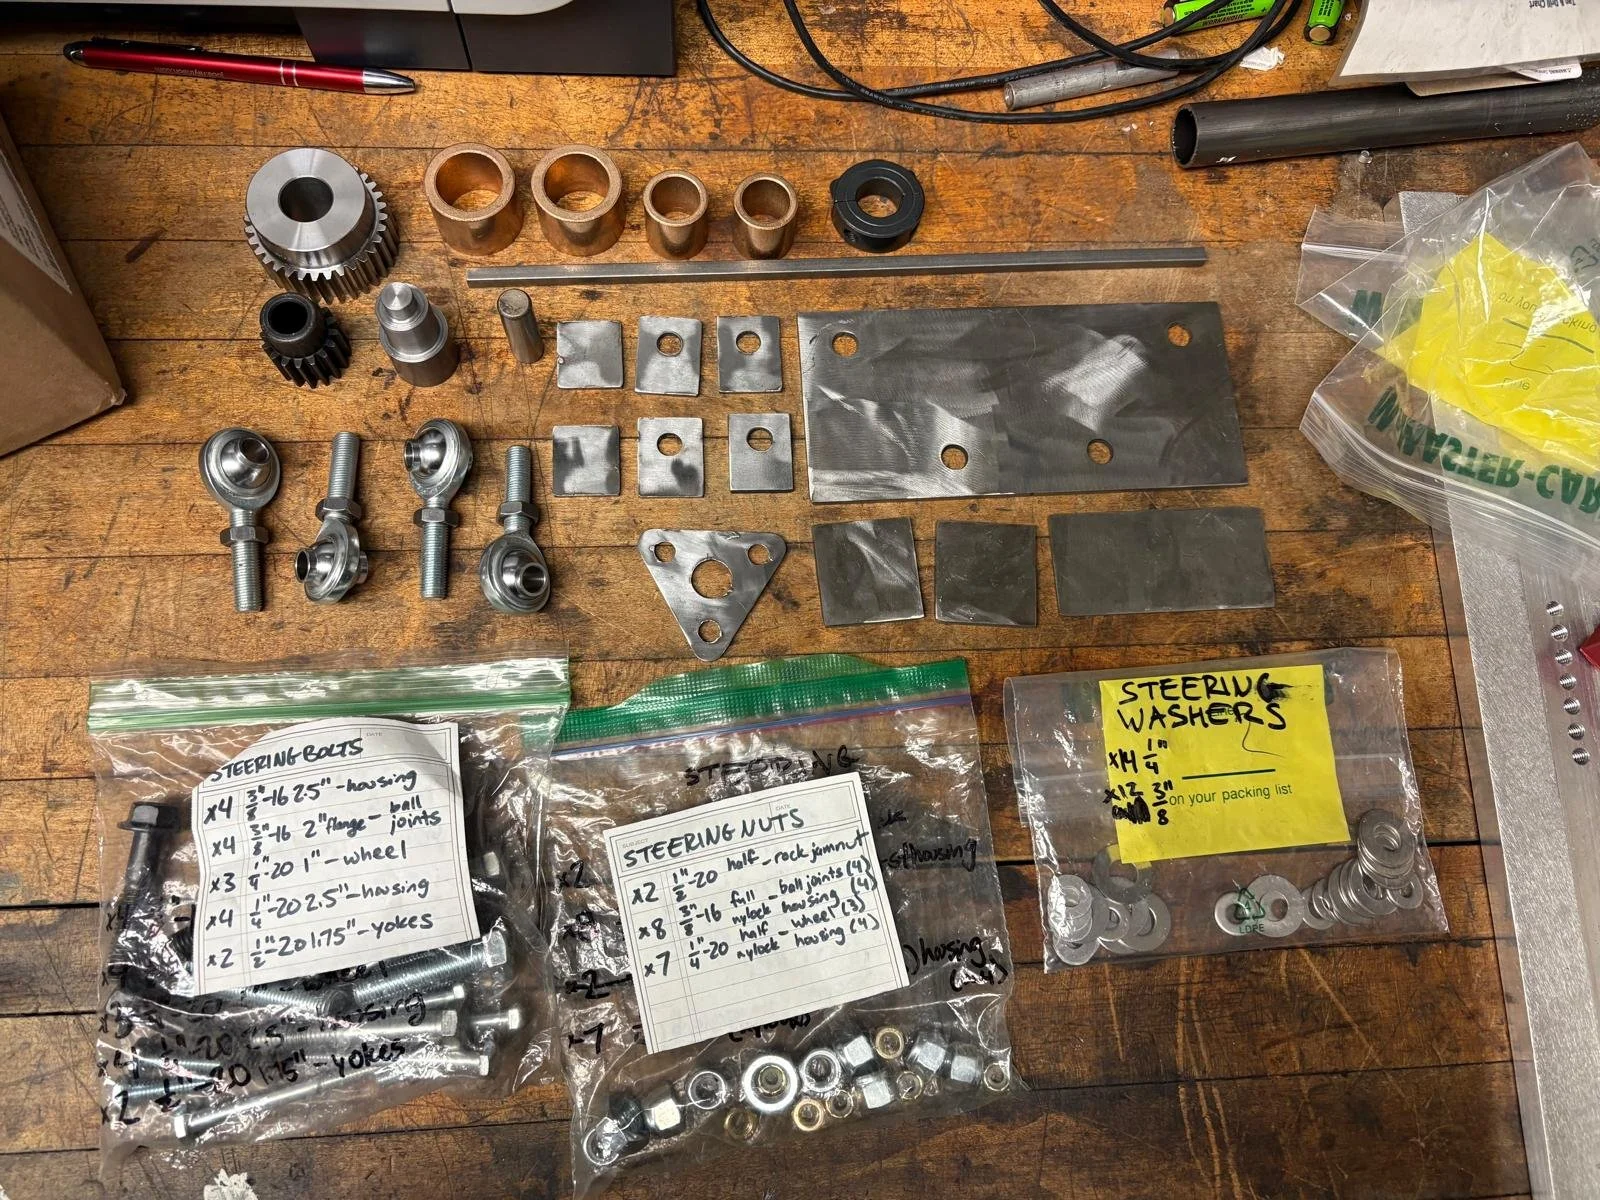
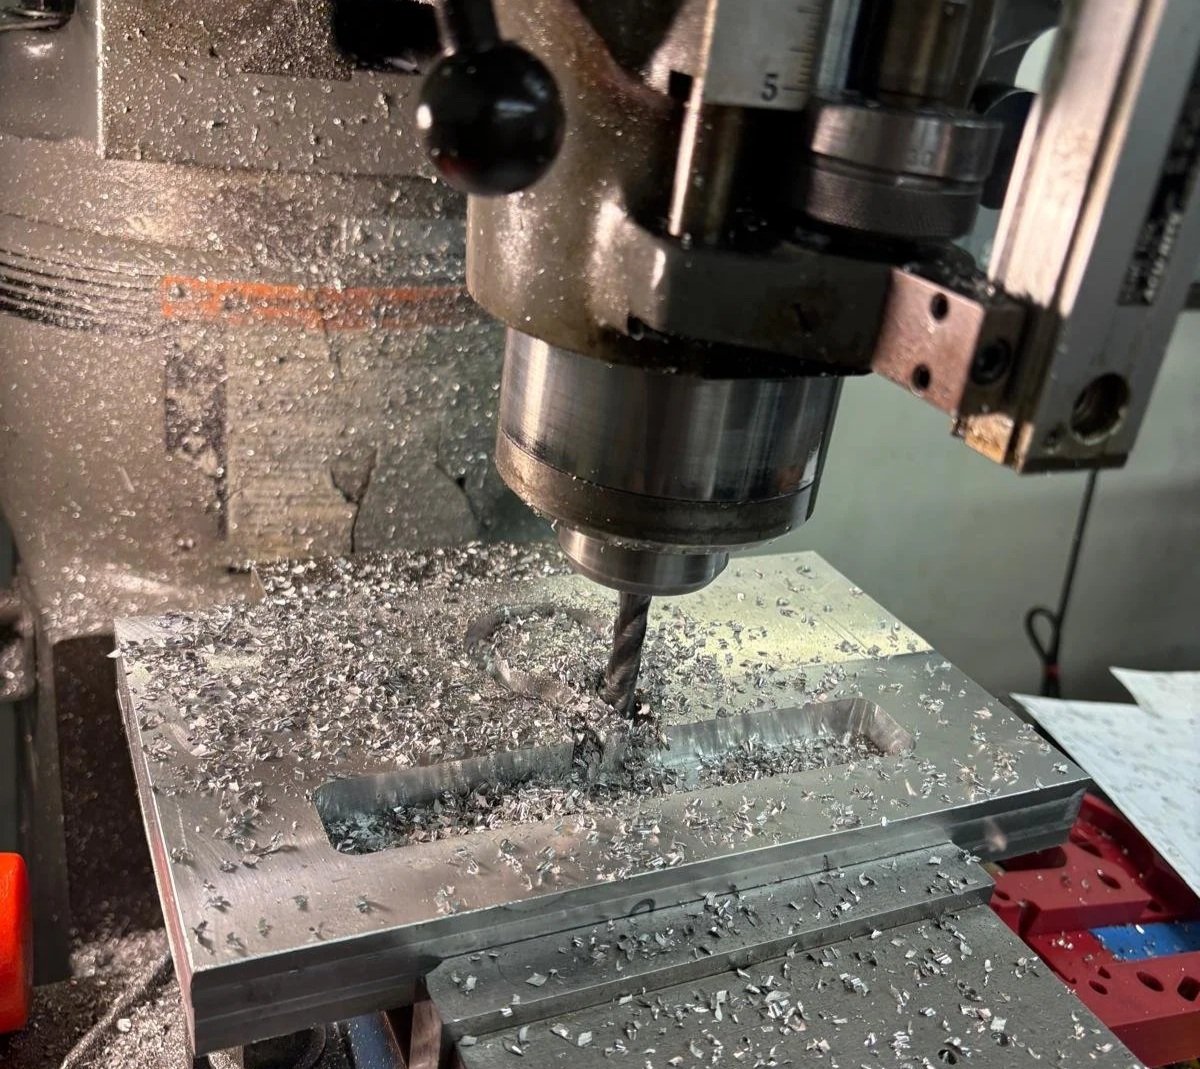
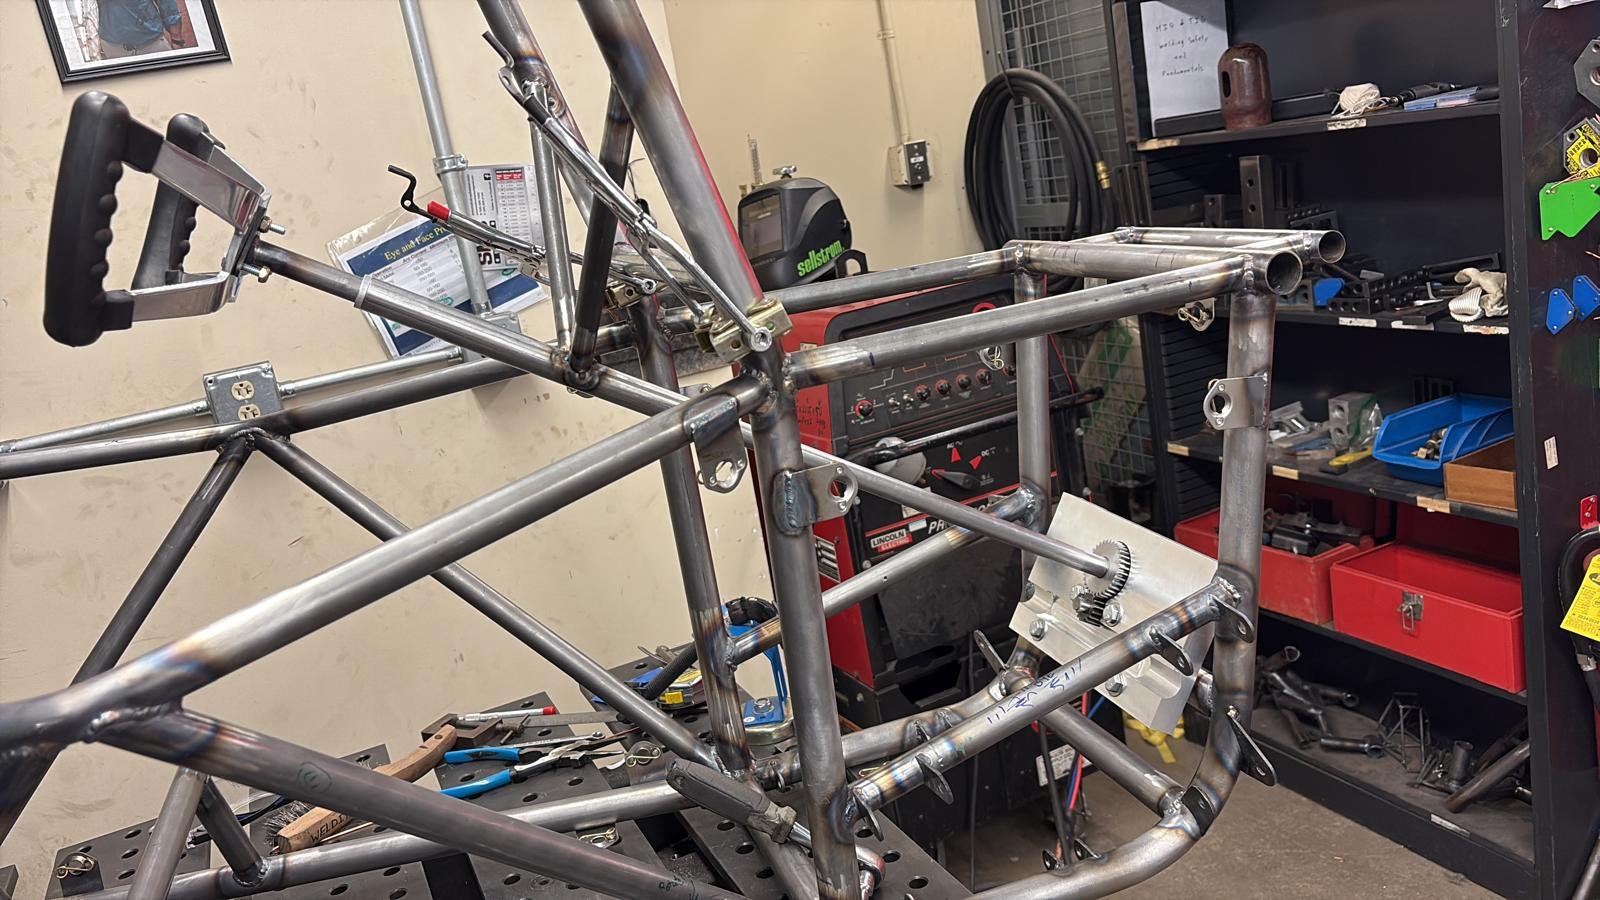
To manufacture the steering system, I used a variety of tools. I 3D printed prototypes of the steering housing to test fit (top left). I used a milling machine (top right), lathe, and hand tools to manufacture larger components. Then I plasma cut mounting tabs (bottom left), and fixtured all components to the frame to prepare for welding (bottom right).
Lastly, I assembled the entire steering system in tandem with the suspension and the rest of the car (far right).
Results and Improvements
Eliminated all interference with suspension a-arms
Met all requirements
Reduced subsystem weight by 6 pounds
Improved driver comfort and control
Increased design evaluation score by 20%